

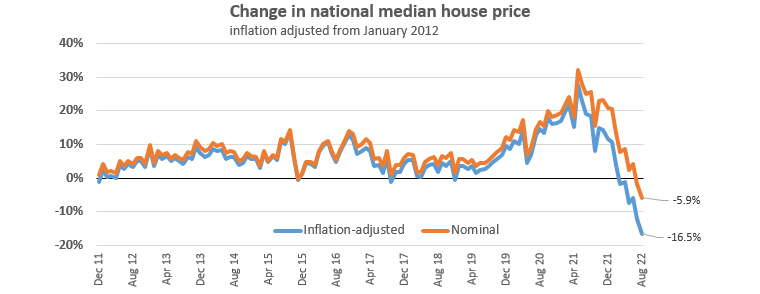
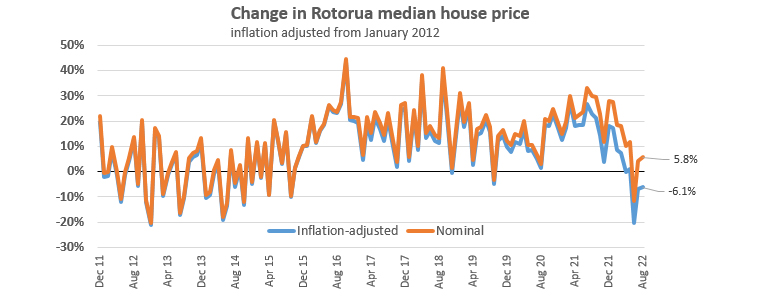
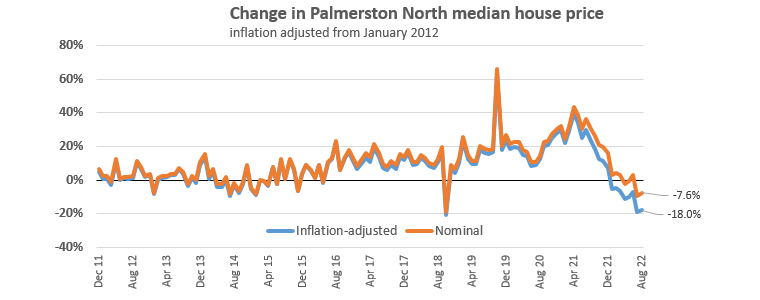
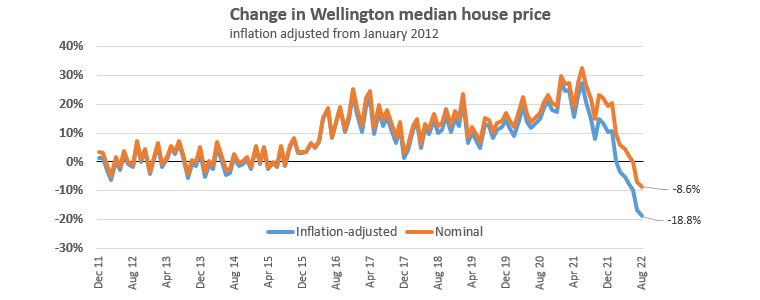
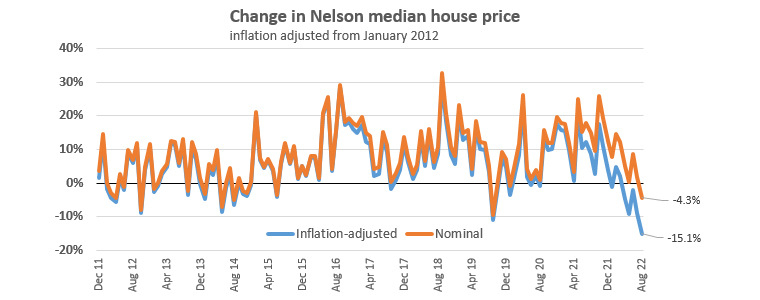
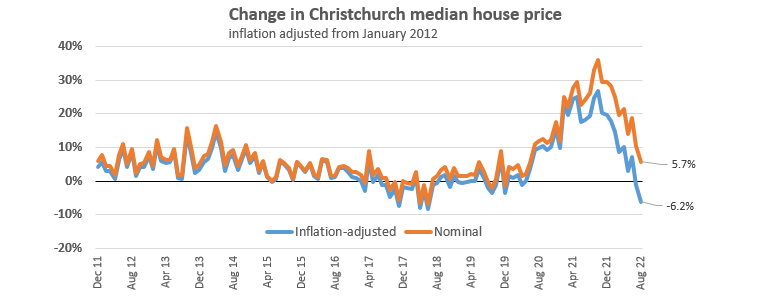
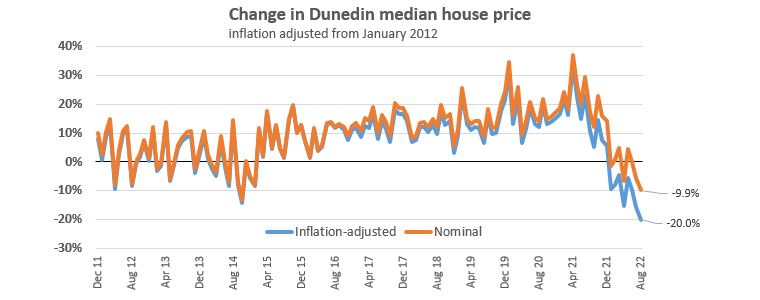
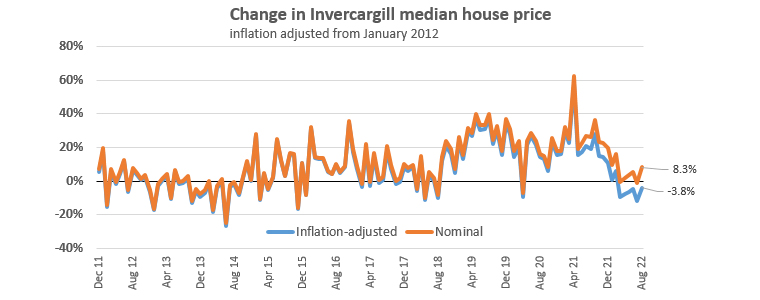
Our previous review of how inflation has affected house prices over the past decade only revealed national and Auckland changes.
But of course we have the data for all urban centres.
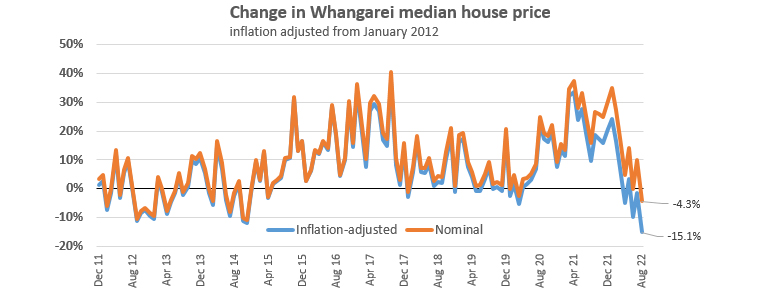
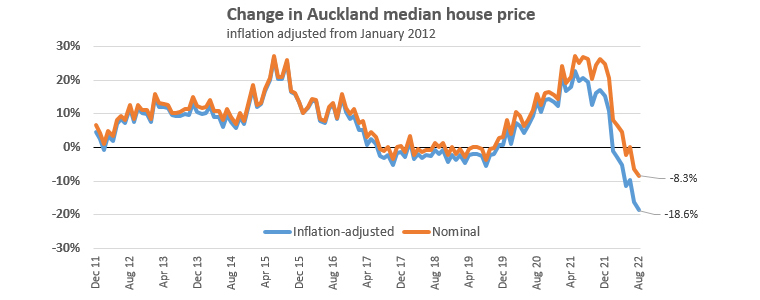
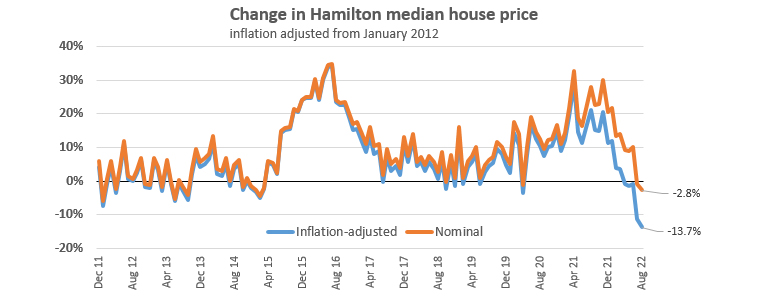
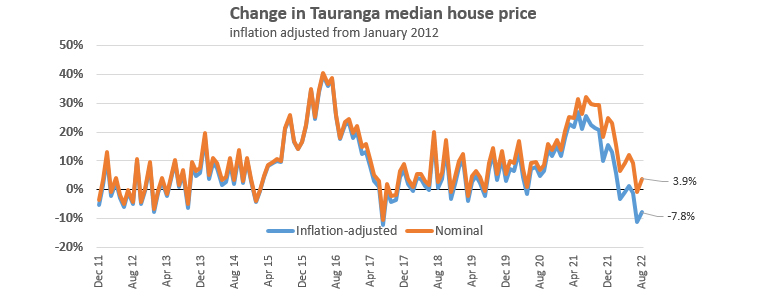
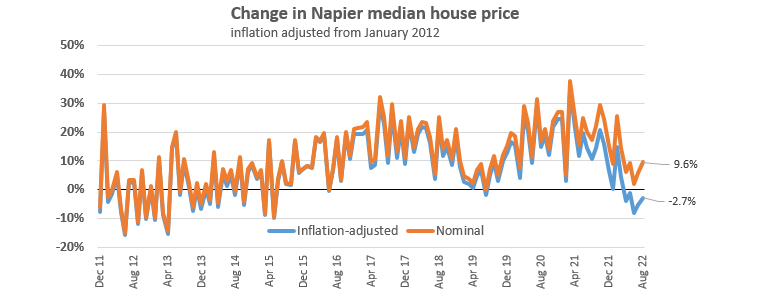
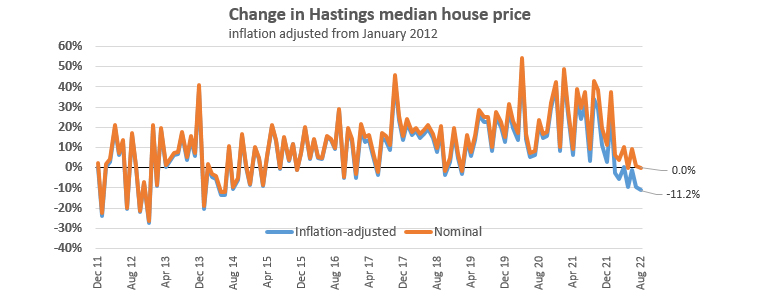
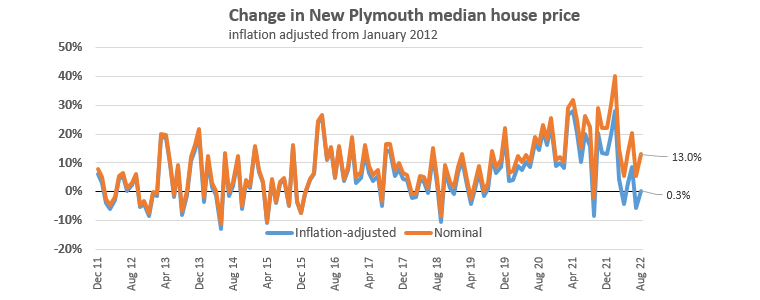
Here are the results for all 14 main centres. Clearly, the largest centres have a major influence on the national result.
67 Comments
I don't really see the point of house price falls in real terms. Not actually sure if it tells us anything meaningful. In fact, it could amost be used for spruiking: "Look. House prices down XX% in real terms. Crash is over."
If you track changes in CPI, house prices, and earnings over the long term, it's quite apparent that earnings lag far behind. Does inflation really diminish debt? I would argue that in the past, yes, when there was a stronger correlation between CPI inflation and wage inflation. I don't think that is the case now for a variety of reasons, including the advancement of technology.
I have observed a very strong correlation between CPI and wage inflation. Anyone got a chart?
I have observed a very strong correlation between CPI and wage inflation. Anyone got a chart?
I've seen an index for Aussie. The slopes are entirely different and of course house price changes outstrip the CPI by a wide margin.
That entirely depends on the industry, most healthcare workers are way behind the CPLie
I've mentioned this before (and been laughed at/ridiculed about it), but another option is to compare nominal house prices with gold (aka hard money) that removes the effect of destroying the value of the fiat currency that houses are traded in.
One way of seeing if houses are being overpriced/underpriced relative to fiat devaluation.
I've mentioned this before (and been laughed at/ridiculed about it), but another option is to compare nominal house prices with gold (aka hard money) that removes the effect of destroying the value of the fiat currency that houses are traded in.
I agree with you. But I would only look at the relationship directionally. As we know, the price of gold is heavily manipulated by derivatives (some actually dispute this).
For sure - nothing is perfect huh.
Yep. BTW, there is a great chart showing the changes in broad money between USD, Euro, and JPY. Despite what people are led to believe, money growth is far lower in Japan, despite quantitative easing. And the reason for that is quite clear: Japanese firms and h'holds are not borrowing.
Alright in theory but gold has it limitations as a standard
Does inflation really diminish debt?
Yes, in real terms, provided you're talking about actual inflation and not just an increase in the price of things. The CPI measures the latter, which is why it's pretty much useless for calculating the price of anything in real terms.
Explain how inflation diminishes debt?
Inflation diminishes debt because income roughly moves with inflation. Over time you earn much more but the debt remains the same. Joe Bloggs who took out a "massive" mortgage of $300k 10 years ago, has a mortgage which isn't that huge in today's terms, even if he hasn't made any principal repayments.
You cannot claim that inflation reduces house values as DC does in this article, but then argue it doesn't diminish debt equally.
"because income roughly moves with inflation"
And what if they don't?
There's no immutable Law that says wages have to rise with inflation. In fact, as input prices rise; employers cut costs and that could include wages/jobs.
It's not Inflation that has Reduced Debt in the past, but Income Rises. I don't know what the paper workers who have a mortgage got in Kawerau, to go back to work, but whatever it was just having a job was probably the bonus.
Why has the ratio of Mortgage Debt/Income blown out from 3 times income to 8,9,or 15 today? Answer: Because wages haven't kept up with Property Price Inflation.
But this is nonsense. Wage inflation does not match CPI inflation, monetary inflation, or asset price inflation.
That's why I wrote: "income roughly moves with inflation"
That's why I wrote: "income roughly moves with inflation"
If the growth of income < growth in CPI and asset prices, then inflation does not really diminish debt. It's not difficult to grasp.
"If the growth of income < growth in CPI and asset prices, then inflation does not really diminish debt"
That's incorrect JC. Agreed if growth of income < growth in CPI you are going backwards cashflow wise, but you still have more income than before, whereas your debt has remained the same, therefore the debt diminishes compared to your income, which is now higher.
Not always going backwards. If CPI = 8% and wage inflation = 5%, but the person has a mortgage fixed for 5 years and they spend 40% of their pay on the mortgage, then 60% of their pay is exposed to CPI.
8% x 60% = 4.8% effective. The 5% pay rise is across the whole salary (including the mortgage portion), but they have the discretion of applying that fully to consumer spending.
Inflation reduces the value of debt in purchasing power terms as it does to income after taxes so until income exceeds inflation plus taxes the debt at best remains of constant value or more likely decreases in terms of purchasing power to repay, lower asset value helps those buying at reduced price but increases cost of servicing debt private and Govt as they are re financed. As I have said before the Chicago Fed calculated that to cap inflation interest must exceed CPI by 2-2.5% so with inflation at 6-7% commercial interest at 8.5-9.5% is required or for RBNZ wait until rates fall at which time borrowers have already had the purchasing power of the asset reduced possibly quite considerably and GOvt will require more taxes to pay the increased interest at a time when Tax revenue is falling and benefits increasing. It is not different this time as some espouse - debt has to repaid and the law of supply/demand remains and price is the elastic and it will be stretched possibly to breaking point - check out 1795 and how Marie Antoinette fared.
totally agree
@Yvil: Wage inflation diminishes debt. Fixed that for you.
Inflation reduces the value of the currency in which the debt is denominated, thereby reducing the value of that debt in real terms.
Well said Chebbo
After the sustained capital growth recorded across the housing sector since December 2011 (see charts above) the current market correction is turning out to be a mild one.
Furthermore, leading indicators now suggest the tide is beginning to turn......
In another 12-24months, nominal house prices might well be significantly higher than they are today. 🥺
TTP
What we got there TTP? A reckon, a troll dump, or a rationale with outcome?
Since he started calling this a soft landing or gentle market correction, the market has fallen another 5-10% with no sign of bottoming. I wouldn't take him too seriously.
The housing price crash only just started. NZD tanking will keep inflation way above target levels. FED set to raise rates again so RBNZ will just follow as these rate hikes take a little while to hit mortgage holders each month more and more pressure will be put on house price’s, once people realise this is not just a small correction as TTP suggests the selling frenzy will start.
What leading indicators are you imagining?
look at the trajectory of the national median house price, does it look like it is a turning tide? or does it look like there's momentum behind it with fundamentals that only support a crashing market?
Might well be, might well not be hmmm, if only incomes would grow, inflation drop and mortgage rates decrease. Then maybe house prices might increase. What a conundrum or maybe prices increase because some people say they will. Popcorn.
Haha man you crack me up! I know your doing it for the reaction but I still love reading the silly comments you think up against all evidence. Keep up the good work.
Inflation is money getting weaker, debt is negative money. If money loses value, negative money loses value
I agree it doesn't contribute to CPI so a pointless comparison
Real wage fall as well?
Wow, Auckland was very flat from 2017-2020 before handouts started.
Surely we need a new index, the smashed avo index, that measures how many avocados are required to buy a shit house. If you listen to talkback it’s approximately 1 per week apparently.
Hours of work to buy the house. Two metrics: the first being hours of work to buy with cash, and the second being hours of work to buy with a mortgage (period, average rates).
Would be interesting to see how they've tracked over time.
Hutt Valley Market 19th Sept
Selling for less than what you brought for
Interesting article on the herald this week about a house in Hamilton selling for 550K less than what its owners bought it for last year.
For regular followers you will remember in July I mentioned I was watching several properties in the Hutt that bought between March and June 2021.
Two of the properties have sold – the first getting 40K over what it was bought for 12 months later – effectively enough to cover the original price plus the agents selling cost. The house was bought in May 21 for 250K over the RV and slightly below its May QV valuation (about 50K below)
The second property that sold was bought in Sept 21 for 270K over the RV and looks like it was a flipped home. It sold in June for 109K less than the Sept purchase price and 170K above the Sept 19 RV.
The Third property bought in March 21 for a whopping 600K over its 2019 RV and 300K over its March 21 QV valuation. The property is still on the market at 400K below the March 21 purchase price.
What this is demonstrating is that
- The market is definitely back at mid 2021 prices and possibly at late 2020 prices.
- Those that overpaid on properties last year are the most vulnerable to taking a large loss in capital.
Unfortunately circumstances can and do change –divorce, death and new jobs requiring relocation will be all drivers for people needing to sell within a short time frame of buying. Human nature means we rarely think of these consequences in hot real-estate market where we literally put everything on the house – but the financial consequences can be enormous.
I’ve finally caved….
Secondly I have read all your comments and given in to the pressure and have created a website with the graphs that judging by your comments you all so desire. I’m just finalising some more data and will have an update on the site and the web address in the next couple of weeks – so stay tuned.
I’m seriously hoping this doesn’t become bigger than Ben Hur.
Current Market Listings
520 houses on the market- Down 15 on last week .
Average number of houses sold each week 25. This data has now been consistent since March with between 90 and 100 houses selling per month according to the REINZ data
520 houses on the market with 25 a week selling means there is 20.8 weeks stock on the market.
House Price Reductions
261 houses have a listed price
65% of the houses listed with a price have reduced their price since listing
The average markdown has increased this week from 103K to $106K. the fall is due to a number of houses who had discounted heavily coming off the market- lowering the average decline. It should also be noted that a number of houses that listed in June and July are yet to lower their prices, this may indicate this is the lowest they are willing to go on their price
Of those that have listed prices (pool 261) 52 have reduced their prices by 100K
16 have reduced their prices by over 200K, 6 have reduced their prices by 300K and 1 has reduced their price by 400K and 1 has reduced their price by a massive $595K.
The Median house price for all 520 listings is $779K this week
Market Valuations
The latest QV valuations (valuations by QV which are updated every month and give an approximation of a houses value) have now dropped $250K since Jan for the Hutt. The latest QV valuations will be used this month to calculate the new RV’s for Lower Hutt. These will be released in Nov. As previously mentioned a number of people who bought in the last 12-18 months are going to find their house is worth a lot less than what they paid for it.
Homes is showing prices dropped roughly 2.5% in August alone – with most suburbs recording a drop of 25-35K for the month.
The latest round of homes updates came through last week show the following
- Woburn (the hutts most expensive suburb) – average house price is down 310K from $1.66M (in Feb 22) to $1.35M, this is a 6% drop YOY and was a 35K drop from Aug
- Petone is down $220K from $1.19M in Feb to $970K This is a 13% drop YOY and a 25K drop from Aug
- Wainuiomata (the huts cheapest suburb and attractive to investors and FHB’s) is down $175K from $870K in Feb to $695K. this is a 13% drop YOY and a 25K drop from Aug.
Houses sold vs houses removed
My records show 318 houses listed with a Price have sold YTD
I have records of a further 283 houses that have been removed from the market unsold YTD.
28 of those houses removed from the market have been listed on the rental market.
Length of time on the Market
- 390 houses have been on the market for over 30 days - 76% (last week it was 408)
- 302 houses have been on the market for over 60 days - 59% (last week it was 322)
- 237 houses have been on the market for over 90 days – 41% (last week was 207)
- 158 houses have been on the market for over 120 days - 29% (last week was 160)
- 112 of the houses have been on the market for over 150 days - 21%
- 71 of the houses have been on the market for over 180 days (6 months) – 13%
- 24 of the properties have been on the market since 2021 – 4.6%
The number of houses on the market over 60 days is now over 58%. This has risen from 32% of houses in mid March (one in three), 1 in 3 houses have now been on the market more than 3 months , 1 in 4 have been on the market over 4 months and 1 in 10 have been on the market over 6 months.
Rental Market
This week the rental market has 199 properties for rent (up 18 on last week) up 74 on this time last year, – when 125 houses were for rent.
The percentage of properties listed at $650 is at 38%. This is the 9th week in a row where the percentage of rentals over $650 has been less than 40%.
Median Rental price for the Hutt valley is $595 a week (this is slightly up from the previous $580 a week midpoint)
Great update, as always. Thanks!
Interest should publish your updates as independent articles.
Does anyone believe this marketing bs - the previous owners deicided to "share" this property - what, was no rent charged?
Having formerly been a loving home for our Vendors they decided to share this and keep it as a rental property. Unfortunately, the former occupants have left this home in such a devastating, heart-breaking state it has become irreparable for them now being overseas.
https://www.realestate.co.nz/42236257/residential/sale/29-pirie-crescent-moera
Perhaps I should help the agents out:
Our Vendor/slum lords have rented out this house as absentee landlords being overseas for years and years. The party for them is now over as the Labour government brought in a healthy homes standard, and they blame former tenants for letting the property get into this non-compliant state. The only option, arising from their lack of upgrade and maintenance, is to offer the property for demolition. The new owner will need to consider demolition costs in addition to whatever price the bare section might fetch in today's declining market.
I think I'll attend the auction and open the bidding at $50,000. I bet I'll be the only bidder.
That's the result of many years of neglect and very little damage caused by tenants. Disgusting slumlords, I might attend that auction and bid it up to $51k.
This will probably sell around $400k imho
I might attend that auction and bid it up to $51k.
LOL.
I recon anyone would be crazy to pay even the 2019 LV - unless a developer. Not worth plowing say, $700,000+ (i.e., land + dwelling) into a new single dwelling home there.
Thanks for the laugh Kate - enjoyed it!
Nice. Take a cuddly toy with you and throw it in as a sweetener.
Great update thank you! Interesting that the average reduction on asking price for a property is $106k but QV valuations have dropped $250k in the Hutt since January 2022.
Ok not directly comparable numbers but still indicates a lot of sellers are in denial as to what their property is really worth.
That's why it's better to own a house with mortgage (provided you can afford the payments of course) than without, the mortgage gets eaten away at the same rate of inflation as the house's value.
? "...the mortgage gets eaten away at the same rate of inflation as the house's value."
shouldn't this "eating away" rate be less the mortgage interest rate, grossed up at the mortgagees marginal tax rate ?
Do we just ignore increase in wages falling behind increase in cost of living?
Well that's certainly a problem but it's a different issue from comparing the stagnant debt to the rising income. In a way my parenthesis (provided you can afford the mortgage payments) takes care of the issue you raise.
Thanks for these graphs David, very interesting!
This is a speculator map. Where the market went up the most, gravity has the greatest effect.
I suspect negative equity numbers will markedly increase and resilience will be key to many riding out what is ahead. The graphs will continue to trough . How many actually considered that eventually a ceiling would be reached and that affordability would dry up? The reported value drops are not significant enough to offset the cost and availability of credit to the masses and until they reach a level that excites and enables those on the sidelines ,it will be more of the same for RE. Unrealistic to expect the OCR to hold or fall presently . Next year will see many more line up for mortgage resets and they will not be getting the sweet deals of yesterday...Owner occupiers will feel the heat but likely not as much as speculators that have over indulged .
Interesting stats here on last few months of sales compared to last year
https://www.rbnz.govt.nz/statistics/series/lending-and-monetary/new-res…
Just the start IMO - feel for the FHB who purchased in the last 12 months
Those FHBs were idiots or had so much money it didn't matter to them.
I don’t think that’s fair. After years of being told to wait until the crash, they finally gave up once prices started skyrocketing yet again instead of crashing, and now they are getting burnt.
Yes, it is understandable, but I think they were idiots all the same. They should have been able to control themselves better. Now they are paying the price in lost equity (mix of theirs and the bank's/parents). I was "told" the same thing and stayed away from an obvious risk.
Don't confuse being in a position to sit on the sidelines for being smart.
I'm really talking about wisdom and self-control, not smarts.
But I quibble. Yes, we are in the position to rent and see what happens, at the cost of the family feeling cramped and frustrated. We all make our own tradeoffs.
Relationship between CPI and wages is irrelevant to house affordability, since CPI does not include house prices.
For the purposes of buying a house for most people, change in "real" house prices tracks the change in the ratio of average (or median) incomes to average (or median) house prices. By that (accurate) measure of "real" prices, house prices have massively increased in recent years in real terms.
When you see how steep the downward trends are on these charts you can be sure by the time it hits bottom all that’s left is a mess. It will be many years before we see any recovery. If anyone buy a house now by this time next year you will be in negative equity.
As mentioned previously, the times have changed, the thought of property doubling in price every 10 years is well out the door.
Some who purchased at peak might think that house falls does not apply to them because they are not planning to sell any time soon and can still afford the repayments, what they don't realize is that they are $100k or so out of pocket,
Property is only valuable when its value rises.
Or the yield makes sence. Unfortunately for the spec crowd that was about ten years ago. How much capital losses can one endure back to this level...?
A ‘property’ can be valuable for other reasons than simply increasing in $ value. It can be a ‘home’ that is not subject to landlords abruptly ending the tenancies, landlord whims, intrusive inspections, large rent increases, or failure to carry out basic maintenance. It allows you to put down roots into a community if that is what you want, keep your kids at the same school, make a long term garden with fruit trees, decorate the way you want to. Very few rentals in NZ give people those opportunities.
While that's all true but only if its affordable, cause you can't pay for it if its not.
Pretty sure everyone would buy a house if it were affordable and made good sense for their situation.
The economy always follows these graphs "rise and fall" ...about 12 months later.
As your biggest asset losses value so do you. As such you are poorer and spend less...
Shops sell less...
Unemployment rises.
recession!
Well done Stalinda and Robbingson you've Fu@ked the country well and truly!...
You've failed to deliver on ..
Poverty, child abuse, housing, crime, suicides, COL, education, health overseas workers, Air NZ, taxes....
Worst Government ever!
Couldn't agree more. We are already seeing a large uptick in car thefts in Wellington, increased poverty = increased crime.
Not sure what this shows us, they are still double what they were 10 years ago. As is household debt.
We have just borrowed more to compete with each other to enrich our colonial bankers. Bit daft really.
https://www.interest.co.nz/charts/credit/housing-credit2
https://www.interest.co.nz/charts/real-estate/median-price-reinz
We welcome your comments below. If you are not already registered, please register to comment
Remember we welcome robust, respectful and insightful debate. We don't welcome abusive or defamatory comments and will de-register those repeatedly making such comments. Our current comment policy is here.