

New information released by the Reserve Bank suggests the net worth of New Zealand households is 27% higher than previously estimated, the Retirement Policy and Research Centre says.
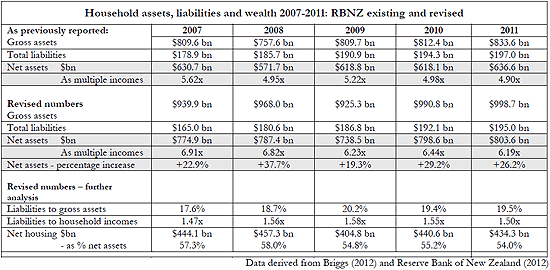
In a report released today entitled a PensionBriefing: New evidence on household wealth from the Reserve Bank, the Centre's co-director, Michael Littlewood, says the new information pushes total gross assets up by 19.8%, total liabilities down by 1%, and means net housing is now 54% of net worth.
Littlewood says the fresh information comes via a Reserve Bank Bulletin article by Phil Briggs and adds to existing data from the Reserve Bank's annual 'Household financial assets and liabilities, housing value and net wealth' reports. Briggs' article helps fill in some "gaps" including households’ equity in unincorporated businesses and unlisted companies, currency holdings, and unfunded equity in public sector superannuation schemes.
"Some assets are still not included," Littlewood says. "These cover overseas property directly owned by New Zealand households, non-equity overseas financial assets and consumer durables."
However, the effect of the newly included assets is to lift gross household assets, as of December 31, 2011 to NZ$998.6 billion, up from the Reserve Bank’s previously reported NZ$833.6 billion.
This is a 19.8% increase. Households’ net wealth rises to NZ$803.6 billion, an increase of 26.2%, from the previously reported NZ$636.6 billion.
“The previously published numbers over the five years 2007 to 2011 missed between one fifth and one third of households’ net assets," says Littlewood. "However, the previously published data on liabilities was reasonably close. In fact, the revised liability numbers are slightly lower. All this means that the ‘missing’ assets are a straight addition to all households’ net worth as the Reserve Bank reports that.”
Meanwhile, Littlewood says the total borrowing of households, including student loans, runs at about one fifth of gross assets. Or, expressed another way, total liabilities are about 1.5 times household incomes across the five years covered. Littlewood suggests neither of these measures seem excessive.
The additional data shows total net housing holdings, including rental properties and baches, range between 54% (in 2011) and 58% (in 2008) of total net worth across the five years 2007-2011. Prior to the new data becoming available, it had appeared that net housing assets were 69.6% of total net assets in 2011.
“Until the remaining gaps in the data are filled, the latest household wealth numbers can be regarded as conservative. As with the addition of the ‘missing’ data noted in this PensionBriefing, new assets will probably be added directly to net worth,” says Littlewood. "There still some data gaps to fill so even these new numbers are conservative estimates of the likely actual position at December 31, 2011."
Measured in relation to current household disposable income, he says net wealth has increased by 78% in real terms in the 31 years to December 31, 2011.
"New Zealanders are probably used to hearing they are not good savers, that they rely too much on housing and have borrowed too much. Those messages provided the policy backdrop for initiatives like the New Zealand Superannuation Fund and KiwiSaver," Littlewood says. "The evidence for this received wisdom is actually very unclear."
We welcome your comments below. If you are not already registered, please register to comment
Remember we welcome robust, respectful and insightful debate. We don't welcome abusive or defamatory comments and will de-register those repeatedly making such comments. Our current comment policy is here.