

In a recent article, I explained the ‘what, how and why’ of China becoming dominant as New Zealand’s key trading partner. Primarily, it was about the emergence in China of new consumers with increasing spending power and an increased desire for high-protein animal-based food, with the consequent trade facilitated by a free trade agreement.
In that article, I acknowledged an increasing wave of public opinion saying that New Zealand needs to diversify away from China. I also suggested that finding alternative markets would be more than a little challenging, but I did not analyse any of those alternative markets. I left that for this article.
The topic of new market opportunities is huge, so this is just a start, just scratching the surface, and focusing on just one region. The focus here is North East-Asia because it is there – Japan, Korea, Taiwan, and Hong Kong – where incomes are higher than most other parts of Asia.
North-East Asia is also where New Zealand has developed trade relationships over a long period. Last year, these countries came 4th, 5th, 7th and 8th in terms of export importance to New Zealand. However, their combined importance to New Zealand at around 13% of exports compares to 31% for China. Equally if not more important, China has been on a continually rising trajectory of export importance (22% increase over the previous year) but these other locations in North-East Asia have shown stagnant growth as export destinations (collectively 0.2% growth over the previous year).
In searching for insights as to why these contrasts are occurring, and also as to future prospects, a good place to start is by looking at the demographics of the various countries, including New Zealand.
Looking at New Zealand’s own demographics identifies the need for increased exports in the coming decades. There are two reasons for this. First, unlike the countries of North-East Asia, New Zealand has a rapidly increasing population. Second, New Zealand is a country well-endowed in some natural resources but lacking in others. Current lifestyles are built on an export-led economy that provides the income for the items that, as a small country in the South Pacific, New Zealand will always struggle to produce.
Some people might be surprised by the statement that New Zealand has much higher birth rates than the countries of North-East Asia. Thirty-years ago that was not the case, but now it is. The evidence, drawn from United Nations data, is shown in the table below. Sitting alongside the birth-rate data are 2018 economic growth rates from the World Bank.
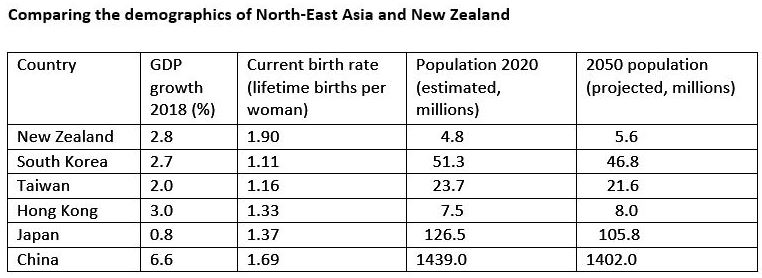
The population projections in that table also come from the United Nations. There is always scope for debate about the fine grain of these population projections, influenced by how birth rates might further change. However, to a large extent the numbers are already ‘baked in’ by the number of females coming through the younger age groups of the demographic pipeline. These particular projections listed here are what the UN calls ‘medium variant’.
The assumptions for most of the North-East Asian countries are that birth rates will actually increase a little over time as countries adopt policies to encourage more children. If they don’t increase, then the population declines by 2050 will be even greater than shown here.
In the case of New Zealand, the assumption is that birth rates will remain much as they are now. There is also an assumption for New Zealand that there will be ongoing net migration to New Zealand of approximately 12,500 people per year.
Even if there is no net migration to New Zealand, the New Zealand population will increase until the 2040s, at which time new deaths will catch up with new births. Alternatively, if net migration returns to a level of say 50,000 people per year, then the New Zealand population will be well over seven million by 2050.
Turning again to the countries of North-East Asia, it is evident that all will have declining populations. For Japan, that decline started close to 10 years ago, with another 17 percent reduction likely by 2050. For Korea, their decline is about to start, and similarly for Taiwan and Hong Kong. China will reach its maximum population in the second half of the current decade and then go into inexorable decline.
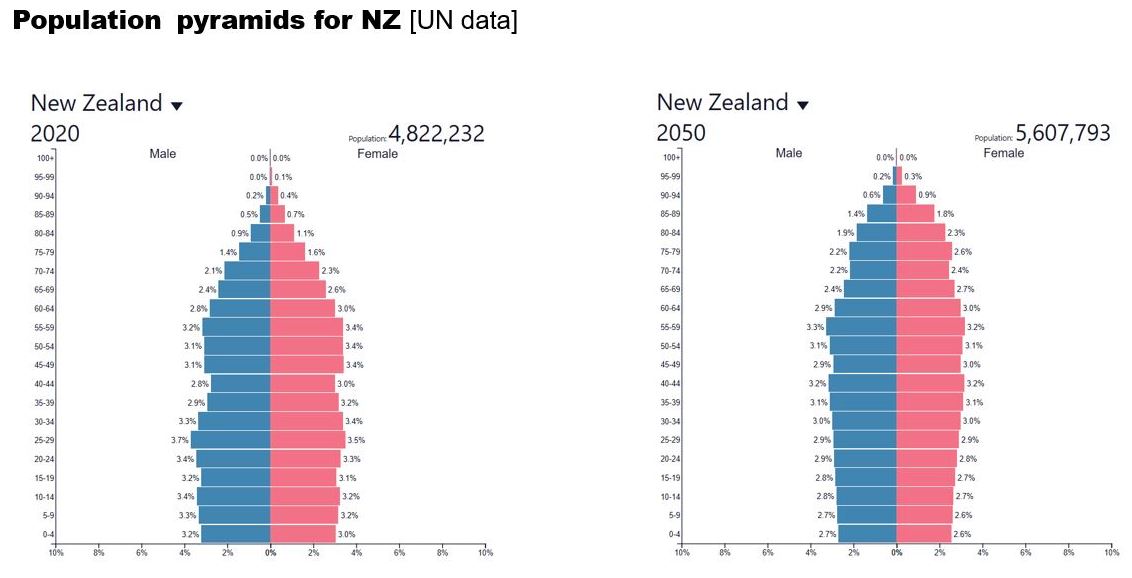
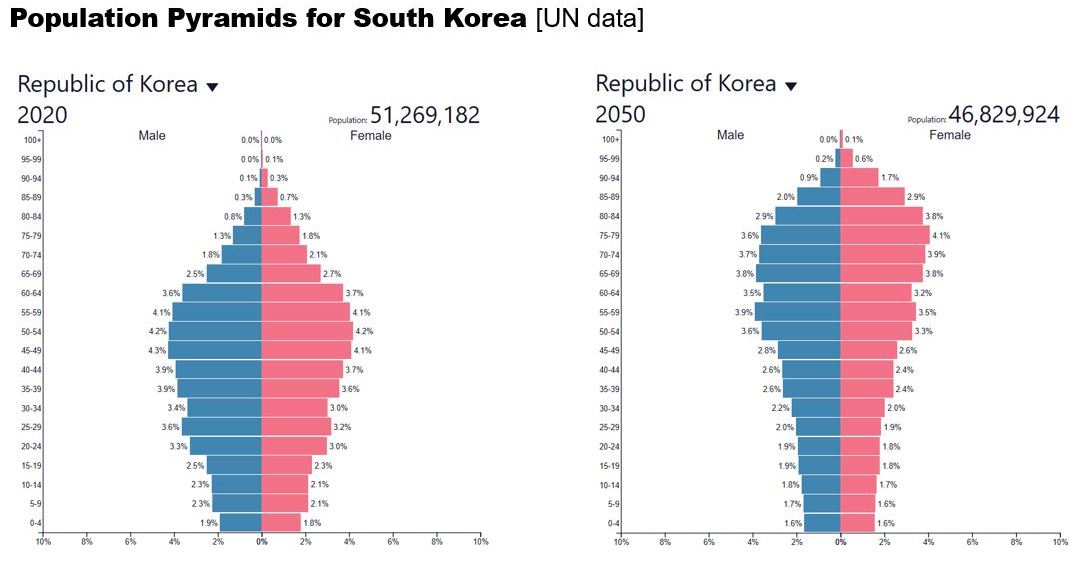
Some aspects of the changing demographics are best illustrated with so-called population pyramids. With birth rates above 2.1 births per women the ‘pyramid’ term is appropriate. However, as birth rates decline below 2.1 children per woman, they reconfigure, first like a misshapen brick wall and then they go inverted. Here, I compare New Zealand and Korea, using visualisation software available from www.populationpyramid.net.
In the case of New Zealand, the current traditional pyramid has already turned into a misshapen brick wall up to the age of around 60. That shape reflects the baby boom that got under way post-World War 2 and reached a birth maximum around 1960. The older age cohorts are still pyramid shaped.
By 2050, the New Zealand pyramid is expected to have a small bulge in the middle, combined with a bigger pyramid at the top caused by a higher proportion of older people than currently. However, if migration occurs at recent pre-COVID levels than the cohorts below 60 years will look somewhat fatter than shown here.
In contrast, Korea already has an inverted pyramid though to about age 50 and then a standard pyramid from about age 60. Alternatively described, it resembles a pear-shaped human with a rather large bulge in the middle.
By 2050, the Korean bulge will have moved upwards and the human shape will have morphed into an equally misshapen ice-cream cone. The lopsided shape arises from the big difference between male and female longevity in Korea. Alternatively, it can also be described as evolving to a very unstable inverted pyramid.
The key message from all of this is that economic growth rates that were already stagnating pre-COVID, combined with low birth rates that have already caused declining population to be ‘baked in’, plus changing age structures, creates a situation whereby developing new markets in these North-East Asian markets will be challenging.
The other marketing message to be drawn from the population pyramids is that as the pyramids become more inverted, the consumer demands also change. It is not only food requirements and quantities that change. Taking Japan as an example, for quite some years the market demand for adult diapers has exceeded the demand for baby diapers. This will also now occur in other countries.
None of the above should be taken as implying that Japan, Korea, Taiwan and Hong Kong lack relevance to New Zealand’s search for market diversification. But it does mean that New Zealand will be swimming against a demographic tide. Accordingly, if New Zealand is going to diversify significantly away from China then it will also have to search in other places. That is a story for another day.
Somewhere in the background there is also another issue that is highly controversial but cannot be avoided for ever. As New Zealand looks to the future and the challenges that lie ahead, what is the ideal population for New Zealand? Citizens will make their own individual decisions that will collectively determine the natural rate of increase. The only lever that governments control is immigration.
*Keith Woodford was Professor of Farm Management and Agribusiness at Lincoln University for 15 years through to 2015. He is now Principal Consultant at AgriFood Systems Ltd. . He can be contacted at kbwoodford@gmail.com. Keith’s previous COVID-19 articles are available here.
We welcome your comments below. If you are not already registered, please register to comment
Remember we welcome robust, respectful and insightful debate. We don't welcome abusive or defamatory comments and will de-register those repeatedly making such comments. Our current comment policy is here.