
The market factors were relatively stable through April, so the weakening of the NZD against the USD meant May AWG prices increased an average of $4per JASm3. AWG prices are likely to be volatile in June and July with uncertain demand due to Covid-19 lockdowns in China and global uncertainty. Once demand does recover later in the year, this demand will likely exceed supply as global log supply to China is still restricted.
The PF Olsen Log Price Index increased $2 to $122 which is $1 below the two-year average, $1 above the three year-average and $3 below the five-year average.
Domestic log market
Log pricing has been consistent through Quarter 2. Some mills are concerned about log supply if AWG prices for export logs fall over the next couple of months and more forest owners restrict or postpone harvesting. This is especially in the South Island where AWG prices are lower than the North Island ports due to higher shipping and port costs.
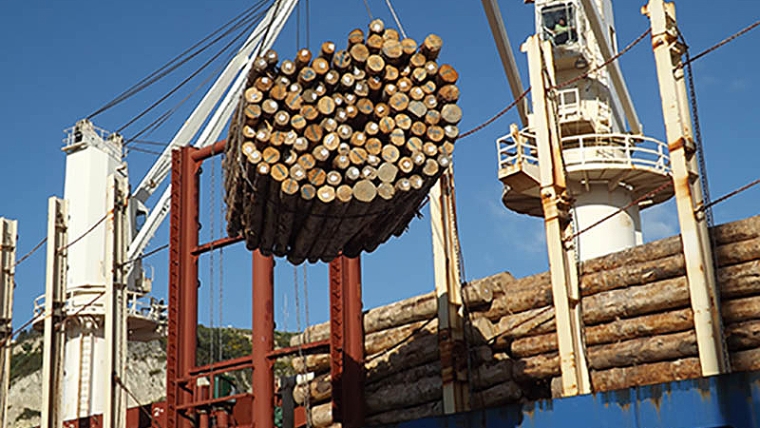
Export log market
China
China softwood log inventory has risen steadily to 5.6m. Considering significant parts of China have been in lockdown, log offtake is still a relatively healthy 70k per day. Activity this May is similar to the last two Mays, but not as high as pre-Covid times when daily log offtake at ports ranged between 85-100k. The CFR price for A grade logs has ranged between 155 and 165 USD per JASm3 during May.

The Chinese economy has been battered by Covid-19 lockdowns. The April Caixin China Manufacturing PMI fell to a 26-month low of 46.0. Both output and new orders fell at the second steepest pace since records began in 2004. Export orders were at the lowest level in two years.
However, there are signs of recovery as lockdowns ease. In Shanghai, Covid-19 test requirements for people entering public places will not be required from June 1. In the last week of May, Chinese investors have snapped up shares of companies that are positioned to benefit from the resumption of normal economic activity. Local Shanghai officials have said they will accelerate approvals for property projects. In addition to this, the State Council (China’s cabinet) has released a 140b yuan (21b USD) package of tax rebates and loans in an effort to stimulate the Chinese economy. This will increase log demand, although China is entering the hotter months when productivity usually slows down. There are promising signals for increased demand from August onwards.
India
About nine bulk shipments of logs are expected in Kandla port in June; five from Uruguay, three from Australia and one from the USA. Demand is still struggling in this area due to a lack of container shipping space for exports which in turn reduces the requirement for pallets. There are containers of USA SYP logs unsold and afloat to Mundra port. This will only increase the pressure on the price. Log buyers also fear demand will fall further in June with monsoon rains forecast to arrive. Sawn timber production and sales always falls between June and September each year during the South West monsoon. Green sawn timber from Uruguay pine is INR 631 per ft3 while green sawn timber from radiata pine is INR 681 per ft3.
Tuticorin on other hand, is facing log shortages due to a lack of supply from the USA and South Africa. Buyers are currently negotiating for part cargoes from Uruguay, to be loaded in June for July delivery. The sawn timber price is INR 750 per ft3.
Exchange Rates
The NZD weakened against the USD from 0.696962 at the end of March to 0.645765 at the end of April, when May AWG prices were set.

NZD:USD

CNY:USD
Ocean Freight
Vessel congestion in New Zealand ports and especially Tauranga is significantly increasing the cost of exporting logs out of New Zealand. The average waiting time in Tauranga is 10 days at a cost of $30k USD per day. This is currently highly variable and unpredictable. Exporters are hopeful this congestion will ease over the next couple of weeks.

Source: TradingEconomics.com
The Baltic Dry Index (BDI) is a composite of three sub-indices, each covering a different carrier size: Capesize (40%), Panamax (30%), and Supramax (30%). It displays an index of the daily USD hire rates across 20 ocean shipping routes. Whilst most of the NZ log trade is shipped in handy size vessels, this segment is strongly influenced by the BDI.

Singapore Bunker Price (IFO380) (red line) versus Brent Oil Price (grey line)
Source: Ship & Bunker
PF Olsen Log Price Index - May 2022
The PF Olsen Log Price Index increased $2 to $122 which is $1 below the two-year average, $1 above the three year-average and $3 below the five-year average.

Basis of Index: This Index is based on prices in the table below weighted in proportions that represent a broad average of log grades produced from a typical pruned forest with an approximate mix of 40% domestic and 60% export supply.
Indicative Average Current Log Prices – May 2021
| Log Grade | $/tonne at mill | $/JAS m3 at wharf | ||||||||||
| May-22 | Apr-22 | Mar-22 | Feb-22 | Dec-21 | Nov-21 | May-22 | Apr-22 | Mar-22 | Feb-22 | Dec-21 | Nov-21 | |
| Pruned (P40) | 180-200 | 180-200 | 180-200 | 180-200 | 180-200 | 180-200 | 160-180 | 160-180 | 150-160 | 150-160 | 150-160 | 150-160 |
| Structural (S30) | 120-155 | 120-155 | 120-155 | 120-155 | 120-155 | 120-155 | ||||||
| Structural (S20) | 100-105 | 100-105 | 100-105 | 100-105 | 100-105 | 100-105 | ||||||
| Export A | 133 | 129 | 141 | 141 | 108 | 108 | ||||||
| Export K | 125 | 121 | 132 | 132 | 99 | 99 | ||||||
| Export KI | 117 | 113 | 125 | 125 | 90 | 90 | ||||||
| Export KIS | 109 | 105 | 117 | 117 | 82 | 82 | ||||||
| Pulp | 46 | 46 | 46 | 46 | 46 | 46 | ||||||
Note: Actual prices will vary according to regional supply/demand balances, varying cost structures and grade variation. These prices should be used as a guide only.
A longer series of these prices is available here.
Log Prices
Select chart tabs
This article is reproduced from PF Olsen's Wood Matters, with permission.
We welcome your comments below. If you are not already registered, please register to comment
Remember we welcome robust, respectful and insightful debate. We don't welcome abusive or defamatory comments and will de-register those repeatedly making such comments. Our current comment policy is here.