
The Ministry for the Environment (MFE) have recently released the latest update of New Zealand’s GHG emissions. Given the time lag in reporting, this is for the 2021 period, and the proximity to the Covid lock downs the ‘recent’ years results are perhaps less meaningful than they have been in the past.
However, overall, since 2020 there has been a 0.7% reduction in gross emissions to 76.8 mtns. This drop is largely attributed to the agricultural sector.
Since 1990 when the record keeping began in earnest there have been several years when negative comparisons have occurred although it could be argued that this time the drop is more greatly due to government policies and farmers attempt to reduce GHG’s. Even the MFE agree that Covid would have had little reducing impact upon agriculture, in fact given the delays that have been occurring getting livestock to processors the reverse could be argued although the amounts would be at the fringes of the reporting scale.
The reductions in nitrogen fertiliser inputs are one area where reductions can be shown and livestock numbers another.
In the past the falls seem largely due to droughts, and occurrences such as the financial crisis of 2008. Of course future occurrences may also show this surmising to be totally wrong, however, we shall see.
Unfortunately, before the ag sector can start any collective back slapping, since 1990, when we were meant to be starting to reduce GHG outputs the sector GHG gross outputs have increased by around 13%. Ironically given the discussions around carbon farming, nationally, net emissions (i.e. after Land Use Change etc) have actually increased in the 12 months post 2020 by 3% and this is largely due to the attributed reductions in removals by forestry. This is likely to reverse in upcoming years which with continuing declines from agriculture should mean that we can look forward to locking in future reductions, at least from the land-based sectors.
Perhaps of interest is with dairy, despite having year on year reductions in total cow numbers (4.99m in 2017/18 to 4.90 in 2020/21) along with a comparable number of herd reductions the actual average number of cows farmed per hectare has increased slightly (2.84 per ha to 2.86). Given reductions in nitrogen over this period the reduction in cows but slightly increased stocking rate means that the farms that are leaving dairying are likely on less productive land rather than the remaining farmers lifting stocking rates. Sheep numbers also have declined over this period.
Despite the gains being made in agriculture (be them modest) there is still yet to be any sign of the same trends occurring in the energy sector (Transport and fossil fuelled energy). Since 1990 energy has increased by approximately 30% and if ‘we’ take out the covid effect of 2020 it further increases to approximately 37%.
Given the lack of focus applied by governments (and oppositions) to this sector (which does happen to include all of us) it does make criticisms of agriculture attempts to reduce outputs look all the more cynical, especially given the impact upon GDP that agriculture contributes.
The LULUCF sector keeps track of greenhouse gases from land use such as forests, crops and pasture and changes in use and so an argument can be made that an inclusion of LULUFC with agriculture makes sense. In the meantime the gap between energy and agriculture is closing and back in 1990 energy had 14.6% of the gross GHG’s emissions when compared to agriculture it now has only 8.6% difference and the rate is likely to close as agriculture continues to reduce and there is little sign of such moves occurring in energy in the short(ish) term.
Percent of National Gross GHG emissions
| 1990 | 2021 | |
| Energy | 36.9% | 40.6% |
| Agriculture | 51.5% | 49.2% |
Source: Data from MFE
There are increasing criticisms of tree plantings being allowed to be used as off sets especially when they are used to offset fossil fuel use as they are disguising the ‘real’ rate of emissions. In addition if future GHG emissions require overseas off sets then there is plenty of evidence that the money flows go from the least corrupt nations to some of the worst. Given some have said that it could cost upwards of $12billion annually to achieve our committed Paris Agreement goals. The lack of attention to energy appears to continue to be the elephant in the corner. Agricultures gains have been modest but at least there is a forward-looking plan, the latest data (be it 18 months old) continues to show how little has been done to arrest energy emissions.
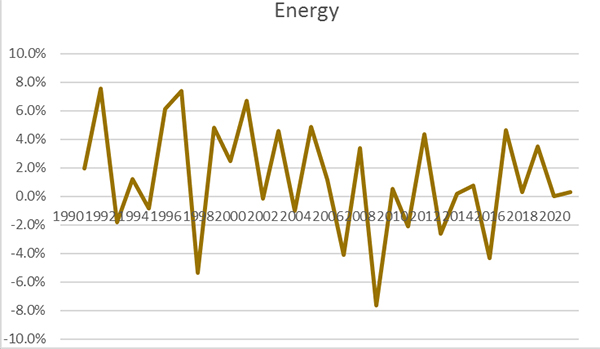
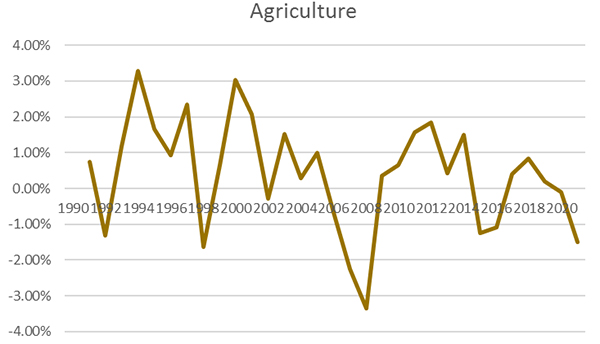
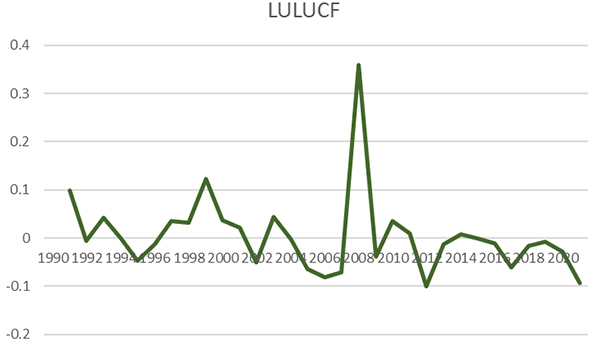
The graphs below are created using MFE data showing the difference in emissions from the previous year and highlight some of the occurrences that have influenced emissions in the different sectors.
The financial crisis in 2008 had a major influence in reducing emissions and increasing LUULCF, perhaps less demand for trees then so less harvested and more sequestration. It also coincided with a very dry year on the back of 2007 which was also dry. My expectation is that we can expect to see LULUCF turn up in the next few reporting periods and agriculture likely continue down and little change to energy in the meantime
We welcome your comments below. If you are not already registered, please register to comment
Remember we welcome robust, respectful and insightful debate. We don't welcome abusive or defamatory comments and will de-register those repeatedly making such comments. Our current comment policy is here.