
By Steven Hail*
I imagine that the economic situation in New Zealand will improve somewhat across 2026, although of course the outbreak of hostilities between the USA and Iran is a massive risk. Market-based economies, if not pushed too far by policy errors or external shocks, tend to be resilient across economic cycles.
Regardless of poor economic management, business investment picks up, partly because of the need to restore depreciating capital and partly just as animal spirits shift. When interest rates are not already close to zero, cuts in policy rates eventually help to prop up the property market. In an economy like modern New Zealand, which has come to look like an economy attached to a property market, that helps create a floor.
That doesn’t change the impression I have from across the Tasman that New Zealand is enduring a period of economic self-harm, with macroeconomic management driven by a mix of conservative ideology and a stubborn adherence to what should by now be a discredited economic paradigm.
Whether it is stories of underfunded public services, the rolling back of environmental protections, record numbers of ambitious young people moving to Australia or elsewhere, and a lack of investment in essential infrastructure, the wonder is that this is happening, when there appears to be no good reason for it, beyond a continued and unthinking adherence to a particular interpretation of section 26G of the Public Finance Act 1989.
While New Zealand is a very small, remote economy, not directly comparable to Australia, and far from the United States, nevertheless I would like to assess the performance of the Christopher Luxon/Nicola Willis government which came to power in October 2023 with reference to data and charts that also plot the evolution of those other economies, not only over the past three years, but prior to that.
The first chart compares the economic growth of those countries over time.
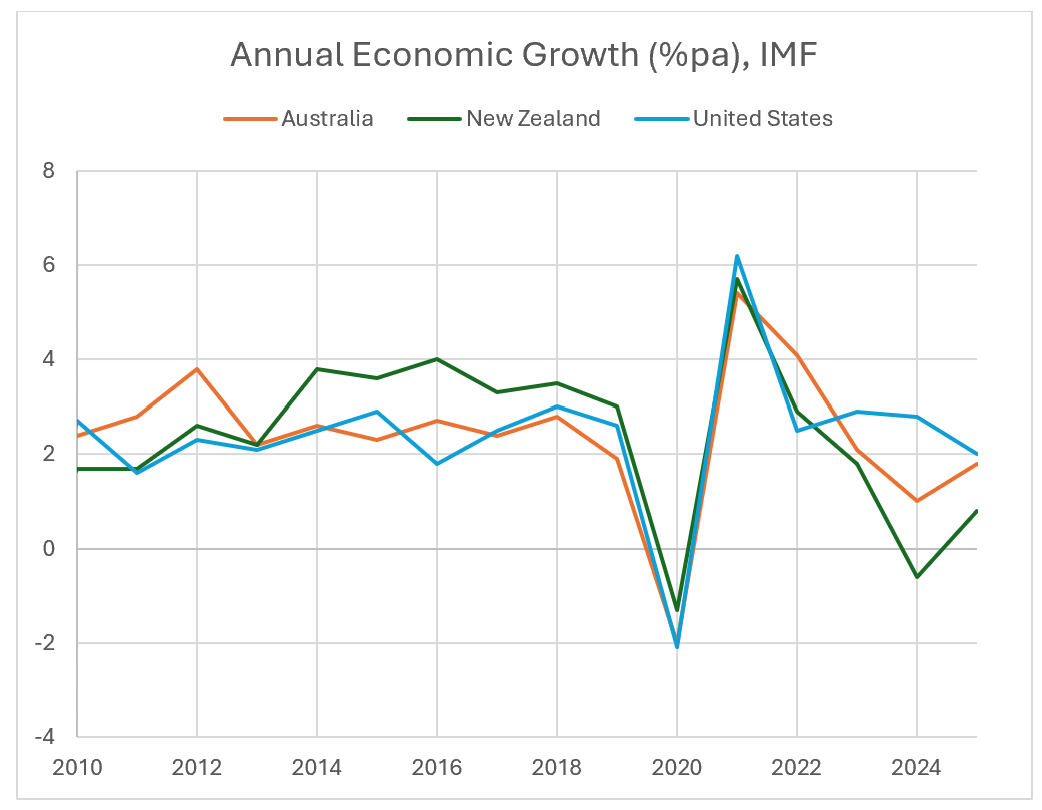
Chart 1: Economic Growth Rates (Source: IMF)
Things do not look good for Luxon here. The economy of New Zealand outperformed those of Australia and the USA for most of the period since the Global Financial Crisis, albeit with far too much reliance on private credit and the housing market, but has significantly underperformed since 2023, with an unnecessary and self-inflicted recession in 2024.
The consequences of this for unemployment, and especially for youth unemployment and push-factors for emigration, are obvious. We can see that in our second chart.
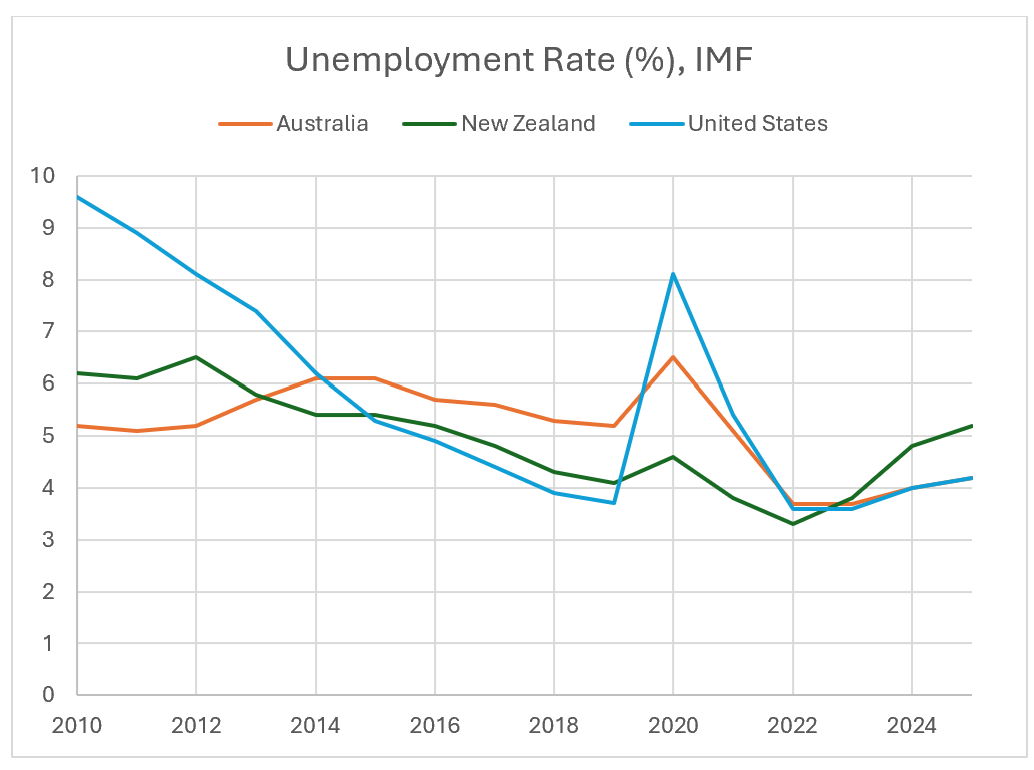
Chart 2: Unemployment Rates (Source: IMF)
Again, New Zealand was a relatively strong performer until 2023 but has underperformed since. Let us not forget that involuntary unemployment is not only a waste of human resources but also has significant non-pecuniary costs for unemployed individuals, their families and communities, disproportionately born by people struggling at the bottom of our societies.
The argument might be that New Zealand’s prior government had let inflation go out of control during and subsequent to the pandemic, through irresponsible fiscal measures alongside other effects driven by the lockdown, so that New Zealand uniquely needed to restore fiscal responsibility to bring inflation back under control.
Let us take a look in our third chart.
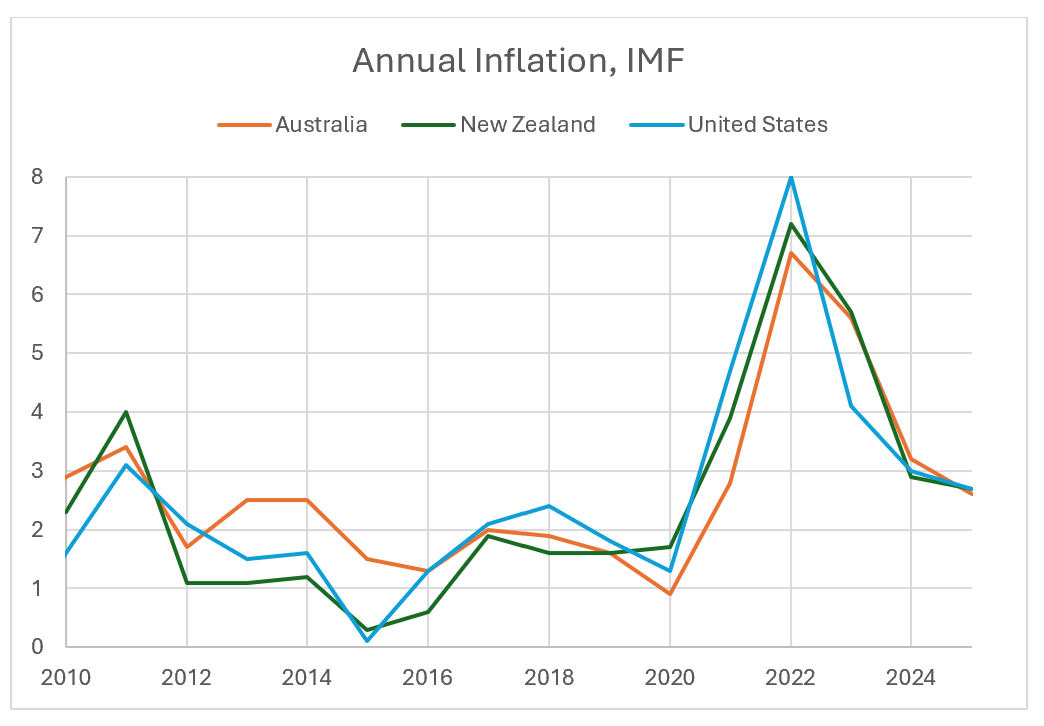
Chart 3: Inflation Rates (Source: IMF)
It is difficult to see this narrative in the data. New Zealand’s experience of inflation has been almost identical to that of the larger economies. There are no signs of idiosyncratic inflationary policies. Moreover, increasingly influential economists like Isabella Weber, supported by research published by major central banks and others, have made the case that pandemic and subsequent inflation was caused mainly by supply-side and global factors, and not by excessive spending.
The rapid increase in policy interest rates in New Zealand and the United States, relative to Australia, does not seem to have ended the inflationary shock any faster in those countries than in Australia. In the United States, it does not even seem to have slowed down spending. The recent self-inflicted weakness of the New Zealand economy has certainly helped drive the Official Cash Rate back down.
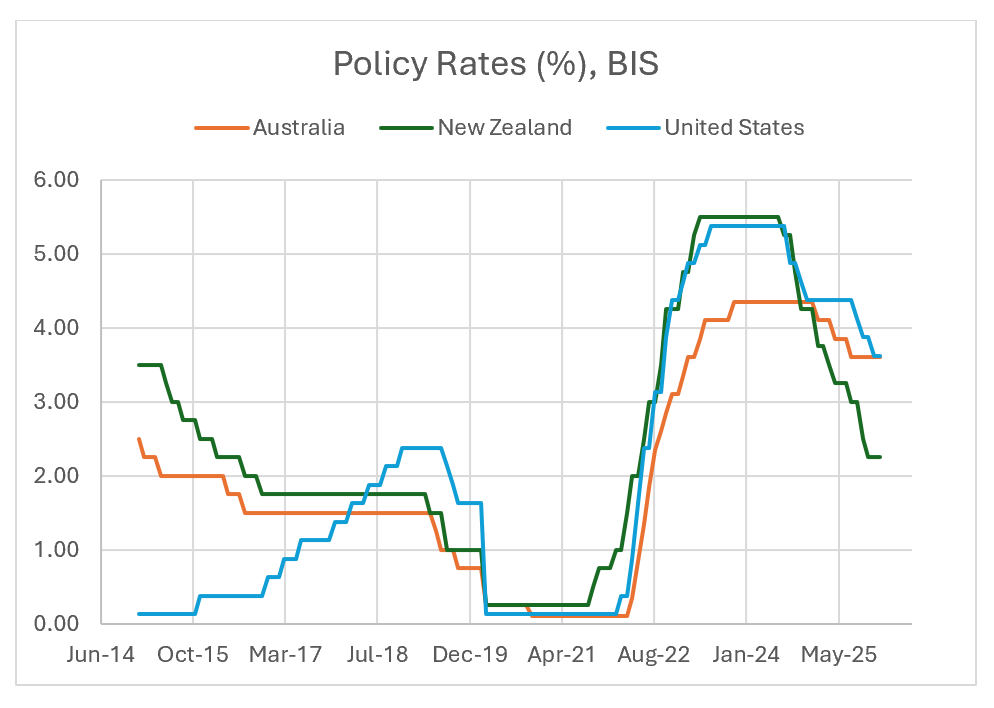
Chart 4: Policy Interest Rates (Source: BIS)
The Luxon/Willis government buys into the supply-side arguments of the 1980s about limiting the size of government, cutting taxes to provide incentives for work and enterprise, and limiting government debt. This is built into the famous 30:30 rule, buttressed by the view that excessive government debt in New Zealand drove high interest rates in the 1990s and that fiscal deficits might cause a run on the New Zealand dollar with knock-on effects on the cost of living.
Institutions like the Organisation for Economic Co-operation and Development abandoned these so-called supply-side arguments a decade ago, as not supported by empirical evidence, but concerns about the fiscal balance and government debt do need to be addressed.
To examine government debt first, let’s use data on general government gross debt, for the sake of international comparability.
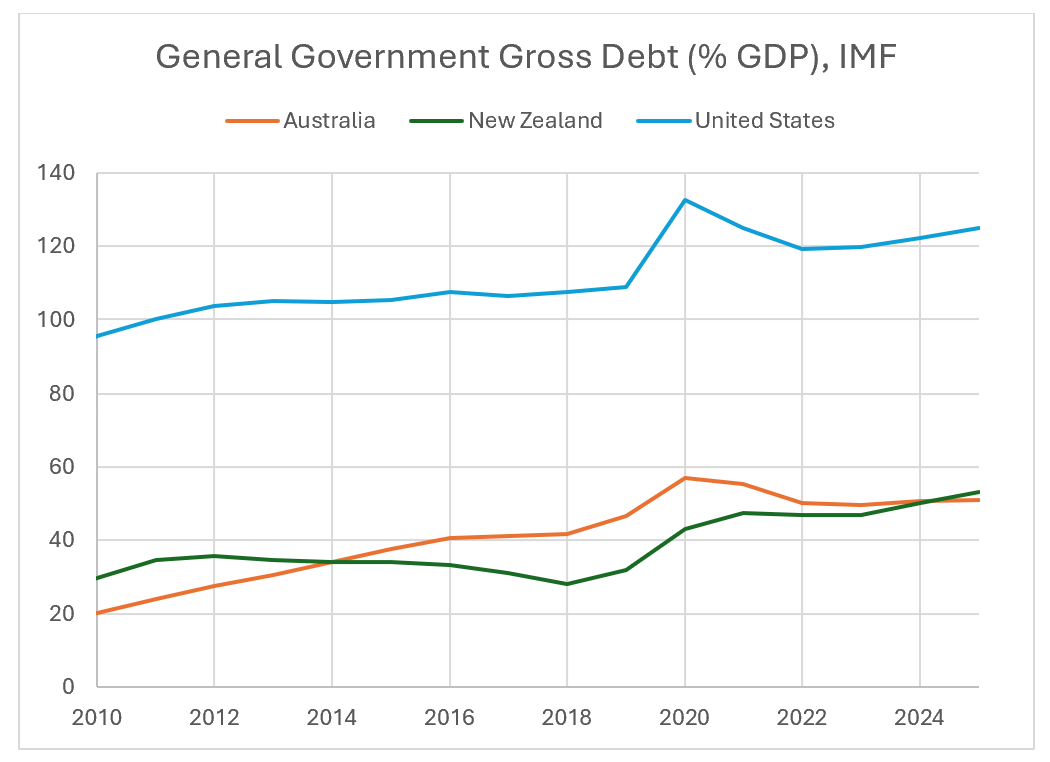
Chart 5: General Government Gross Debt (Source: IMF)
It is difficult to see what New Zealand’s government is worried about. New Zealand, like Australia, is a very low government debt economy. People might argue that the US benefits from being the issuer of the global reserve currency, but the figure for Japan is over 200%.
The point might be made that New Zealand is a country with a current account deficit, so is dependent on foreign financial capital, but so is the United Kingdom, which has a similar ratio to the United States.
There is no reason to see the level of New Zealand government debt as a source of economic risk. Even the interest paid on treasury securities is mainly due to Reserve Bank monetary policy and not driven by the level of the debt.
Economists like me have a very different view of government debt to that which is widely discussed in New Zealand, but we will return to this issue below.
Having addressed the debt, let us examine the government deficit, again using a chart including data for Australia and the United States.
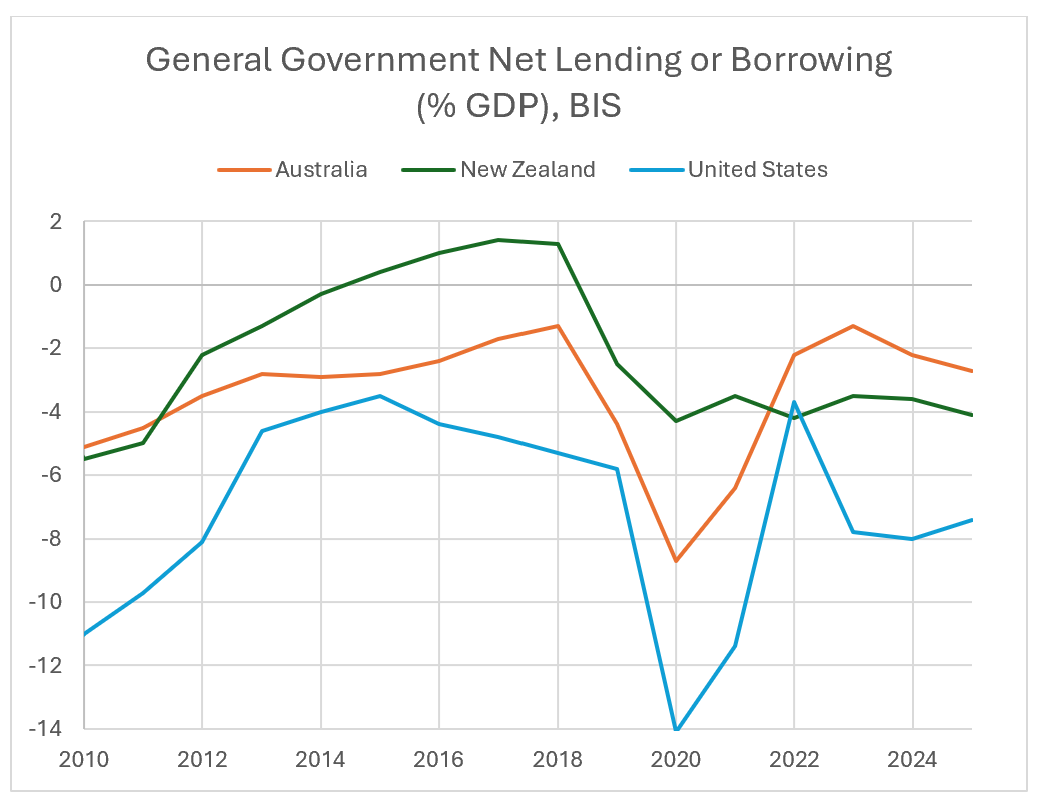
Chart 6: General Government Net Lending (Source: BIS)
Based on this statistic, the only one of these three economies to run annual government financial surpluses since 2010 in New Zealand. Indeed, it is not normal for currency-issuing governments to run such surpluses, as the private sector has a habitual preference to run financial surpluses, and barring trade surpluses a private-sector surplus requires a public-sector deficit.
Governments which attempt to run surpluses often fail, because unless you can run a trade surplus and/or induce the private sector to go further into deficit, your austerity policies will undermine economic prosperity, reduce tax receipts and force additional welfare payments, and ensure you stay in deficit anyway.
The government balance in an economy where policies are aimed at the maintenance of non-inflationary full employment is not a suitable policy target variable. The appropriate fiscal balance will be set endogenously by the desired behaviour of the private sector and the rest of the world at full employment.
If you do not understand this, you will rely on private debt and a property bubble, as was the case before 2020, or will cause a recession and fail to run a surplus in any case.
We should address the argument that New Zealand was especially exposed to financial risks during the 1990s due to its government debt. Let’s take a look at the real (inflation-adjusted) interest rate on long-term government debt.
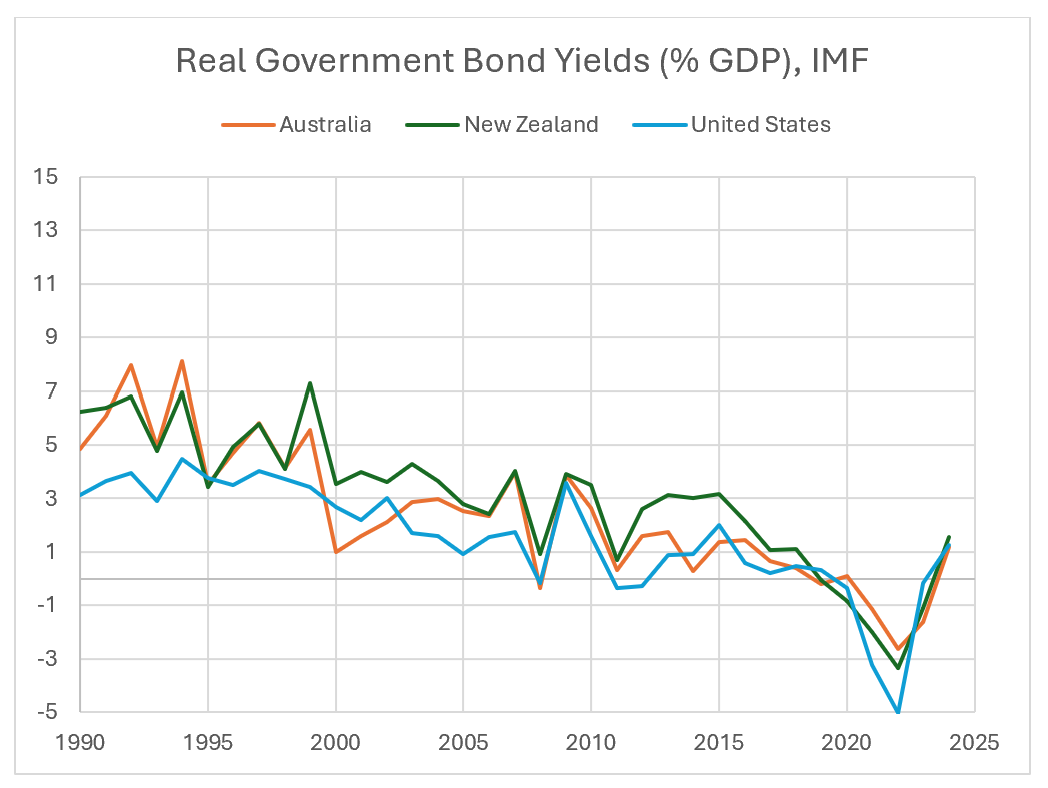
Chart 7: Real Long-Term Bond Yields (Source: IMF)
The chart shows that New Zealand had a similar experience to Australia. You can see a small spike in yields during the Asian Financial Crisis of 1997, but that is about that. Higher yields were a reflection of the market’s expectations of future changes in policy interest rates in both countries.
Another source of concern in a small open economy like New Zealand is the balance of payments, the external value of the currency, and the impact of a run on the currency on import prices and the cost of living.
Let’s examine the current account of the balance of payments.
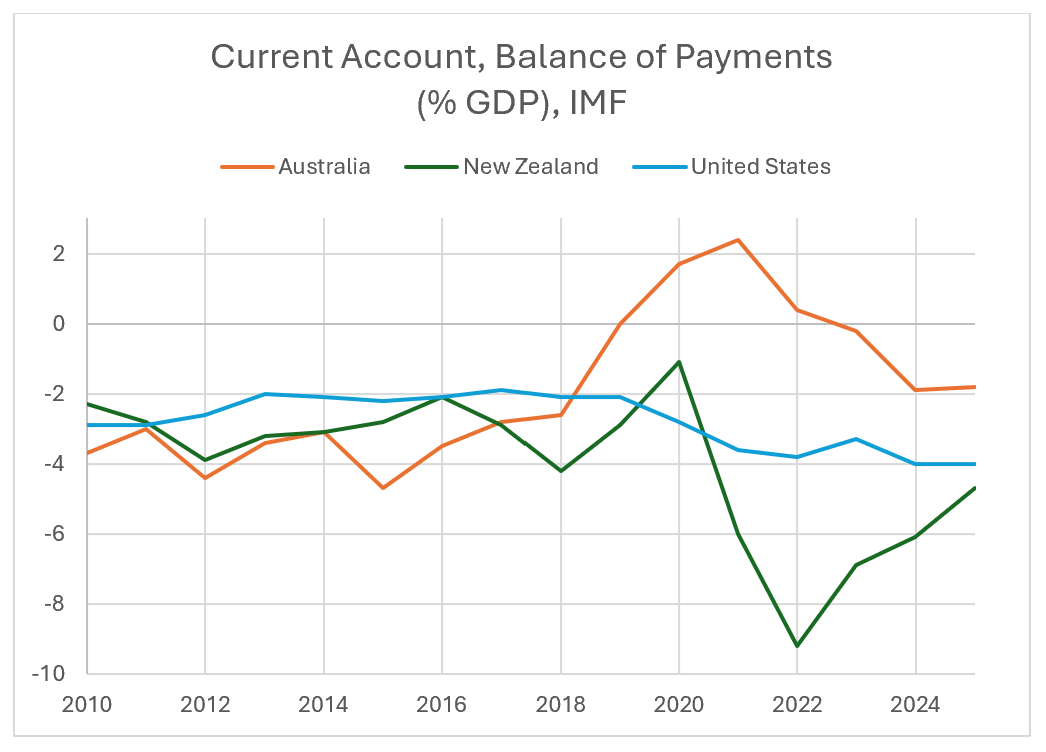
Chart 8: Current Account Balance (Source: IMF)
Here we do see a possible source of concern. New Zealand’s current account deficit grew to be significant in 2022. However, the main causes are not a mystery. Tourism earnings had crashed; imported energy prices had surged; and the fact policy interest rates had risen faster in New Zealand than in most other countries helped to raise net income outflows. That this was widely understood and not a source of potential crisis is shown by an examination of the broad effective exchange rate index.
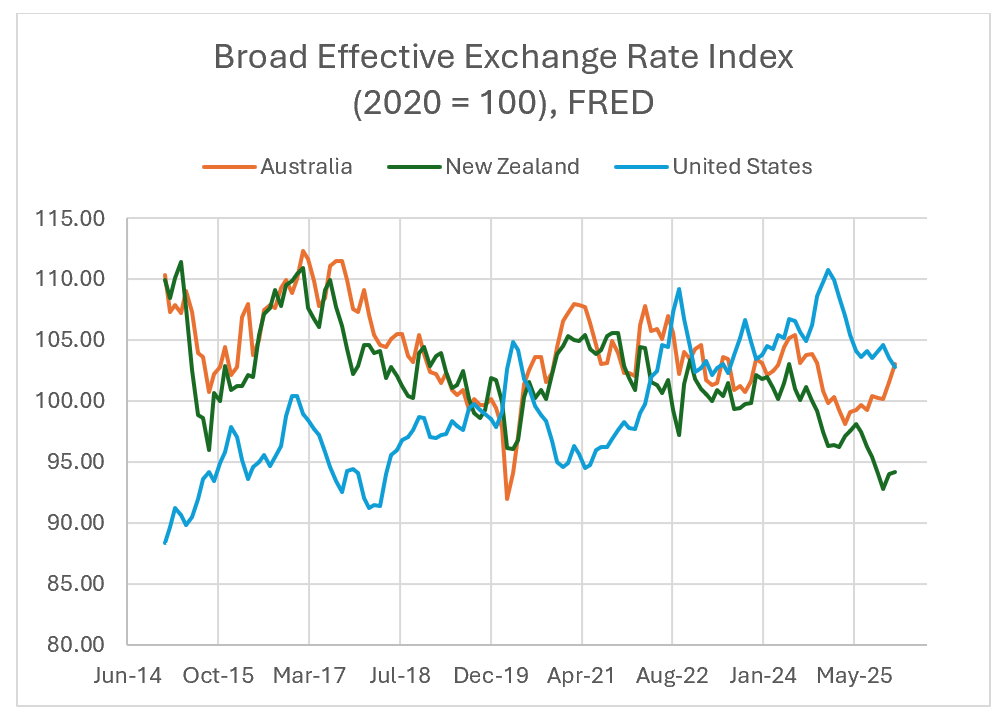
Chart 9: Nominal Effective Exchange Rates (Source: FRED)
There was no depreciation in the New Zealand dollar in 2022, and given monetary policy at the time this is not surprising. It is the weakness of the economy under the Luxon/Willis government which seems to have undermined the New Zealand dollar – not the post-pandemic period prior to October 2023.
I am a modern monetary theory economist. We like to model the economy using an approach called stock-flow consistent monetary economics. A simple tool within that framework is the (increasingly well-known) sectoral balances chart, pioneered by the British economist Wynne Godley. Here is the chart for New Zealand.
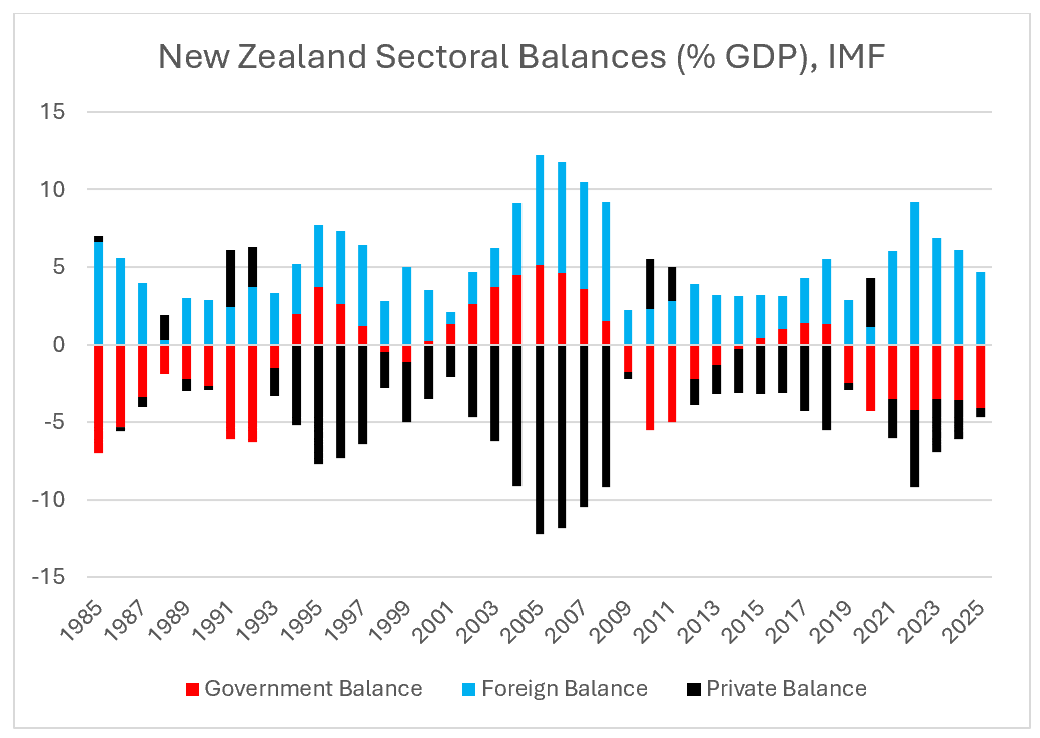
Chart 10: New Zealand Sectoral Balances (Source: IMF)
Almost all high-income economies have positive private balances nearly all the time. Going back to the 1990s, the average of the forty or so countries the International Monetary Fund classifies as having advanced economies has a positive private balance every single year. New Zealand, a little like Australia (but more so), has an unusual, and in my view disastrous chart.
It is disastrous because the private deficits in the chart were mainly driven by a build-up of household debt in an increasingly unaffordable property market. This was a major policy mistake and was completely avoidable. It was the result of section 26G of the Public Finance Act 1989 and its characterization of a prudent fiscal policy as one where “total operating expenses do not exceed total operating revenues”, as though balancing the budget was an appropriate goal for a currency-issuing national government.
The New Zealand economy has rested for years on the back of household debt.
The rest of the world has had a consistent demand for New Zealand assets over many years. This explains the foreign surplus in the chart, which shows up in the balance of payments as a current account deficit for New Zealand. The rest of the world has chosen to sell New Zealand stuff and hold New Zealand assets – not mainly government debt, but mainly private sector assets, including real estate and shares in New Zealand companies.
To facilitate this, someone in New Zealand has had to run deficits. The choice taken by successive New Zealand governments has been for the private sector to run those deficits. Financial deregulation and the encouragement – celebration even – of rising property values driven by rising household debt, has allowed for this to happen. This is not an approach I would have advised, but it is how the economy has been managed. It is how we have got here.
So where are we, at the end of this discussion?
We are at an understanding that government deficits are normal in New Zealand. The New Zealand government is not going to run out of New Zealand dollars. There was no fiscal crisis in October 2023. There was no reason for cancelling infrastructure investments. There has been no reason for underfunding public services.
The New Zealand Government could pursue a vision of a future New Zealand with job opportunities for all (and a job guarantee); could invest in its young people and in the creation of a clean, modern economy; and would be better able to do this if it understood that the means of New Zealand are its people and skills; its capital and technology; its natural resources and its institutional capacity.
This would be a future based on hope which might end the mass emigration to Australia and which, in my view, would tempt ambitious young Australians to move the other way. It would at the very least end the self-harming policies of the past three years.
Editor's note; Somehow in the initial posting of this story the colour codes in the charts got muddled up. This has now been corrected. Apologies for the confusion.
*Steven Hail is an Associate Professor and Director of the Economics of Sustainability program at Torrens University Australia. He is also a Research Scholar at the Global Institute for Sustainable Prosperity and the author of Economics for Sustainable Prosperity, published by Palgrave Macmillan in 2018. He is one of Australia's leading modern monetary theorists.
20 Comments
The rest of the world has chosen to sell New Zealand stuff and hold New Zealand assets – not mainly government debt, but mainly private sector assets, including real estate and shares in New Zealand companies.
To facilitate this, someone in New Zealand has had to run deficits. The choice taken by successive New Zealand governments has been for the private sector to run those deficits. Financial deregulation and the encouragement – celebration even – of rising property values driven by rising household debt, has allowed for this to happen. This is not an approach I would have advised, but it is how the economy has been managed. It is how we have got here.
Very well put. IT reinforces the behavioural norms of asset accumulation for wealth, and the greater wealth accumulated, the faster the asset accumulation leading to a concentration of wealth at the top. The question now being, since we have allowed it to go too far in much of western society, how do we tackle this given the advantage the elite already have.
" The question now being, since we have allowed it to go too far in much of western society, how do we tackle this given the advantage the elite already have."
Use the powers of the state....public ownership of basic infrastructure for a start and a tax regime that encourages the outcomes we want.
It would be easier if the current account wasnt so negative as noted but if we are not losing so much in 'dividends' then we could see an improvement in even that (finally)....then all we need to do is work out how to import less.
Land tax... and reduce income and GST tax. Punish speculation, promote productive work. Easy to implement, unavoidable, regular. Whats not to like?
The blatant state theft of other people's wealth. There's another word for that & while you're at it, replace "elite" with industrious above.
The tall poppy envy of those who have has always been encouraged by those who have not. Including in NZ.
https://www.rnz.co.nz/news/political/588610/new-zealanders-support-more…
Clearly the public agree that one can be wealthy through creativity, hard work and sound business decisions, but the level of wealth accumulated by few is too excessive vs the provision of better services for the public via more effective taxation to prevent such wealth. For example as I have said many times, a 66% top tax rate never stopped many baby boomers becoming engineers, doctors, specialists, surgeons etc. They still had more then most in their pocket at the end of the day and provided a vital service to society. Try considering this today and everyone simply cries foul that the govt is 'robbing' them.
Blatant theft of other people's wealth.
You mean like electricity generators over charging, or perhaps more like the $7 b of wealth extracted by major banks. Maybe you mean the weather extracted from the public purse by the likes of FayRichwhite or Hart.
Rather than envy it's more like tall poppy contempt. I posted a link earlier today that showed up Connor English and his cronies into blatant theft, tall poppy my arse, low down greedy thief.
A comment I once heard from a senior NZ economist - very paraphrased - was that whilst most personal income below $250k represents real contributions, only very few exceptionally skilled and hardworking people can genuinely contribute more than that amount. His default assumption was that personal incomes over 250k were unearned economic rents of one kind or another.
There's an idea in Scandinavian countries of taxing above-normal returns on capital much more highly than normal returns, and if you agree with the above observation then a case could be made for doing the same with labour / personal income. Implicitly that's what a lot of western countries did in the past war period, via very high top personal tax rates, and it seemed to go pretty well on the whole. No mysteriously low productivity growth in that era...
Progressive income tax regimes are Marxist doctrine ("From each according to his abilities, to each according to his needs.")
Why should someone who earns more pay a higher % tax? There's nothing fair about that & its simply subsidising uneconomic population growth (global population increase 3x since WW2 & 33% since 2000).
And our Govt can't be trusted to spend our money: $156k for a kumara patch.
And you know Marxist from what? God how old are you?
Do you seriously think a land tax punishes industriousness more than an income tax? That's a very strange take.
That is not what I said.
I suggest that you buy some land (just imagine the profits needing a big land tax!!!), then learn how to manage drought, floods, wind damage, constant and increasingly difficult to control weed invasions, long hours of work and the never ending risks that you may not break even if your crop gets destroyed by bad weather, market price fluctuations in price for what you produce, high costs of freight in rural areas, poor off farm employment prospects, lower quality infrastructure, fewer choices of education and health services .... a huge learning curve. It's easier to just write comments on interest.co.nz advocating a land tax than engage in the very real struggle that our forbears under took to lift our quality of life to that above subsistence and continued today.
Nigel - land taxes target the passive return on land, so someone in your situation who is adding a lot of value via their own efforts would not be paying a lot of land tax and would likely be better off if we added a land tax and offset it by cutting income taxes. Even more so given that serious land tax proposals tend to exempt agricultural land for pragmatic reasons. It's likely that farmers would be winners.
Looks to me like the countries are consistently mislabelled in all of the charts? NZ should be the dark green?
Just being an economist, means he's ignorant in the prima facie sense.
Of the real world - is the end of the above sentence.
But just about every comment so far, has misunderstood what REAL wealth is. And therefore their comments - like needing land taxes or smaller governments of shorter poppies - all miss the point.
Having resource-access, is wealth. Not having it - isn't. Which means all of us, left right, rich. poor (in NZ) are reducing the wealth available to future generations.
Which is probably why we choose to see wealth in other ways - self-justification is a strong force.
Charts are mislabelled unfortunately.
FYI, I've just posted this note at the foot of the article. The charts should make more sense now; Somehow in the initial posting of this story the colour codes in the charts got muddled up. This has now been corrected. Apologies for the confusion.
There was no fiscal crisis in October 2023. There was no reason for cancelling infrastructure investments. There has been no reason for underfunding public services.
Yeah, basically everyone in NZ could see this except those who actually needed to understand it (Willis/Luxon/Seymour/Peters). Remember when the IMF (I think?) were visiting NZ and were like "WTF are you doing?". Basically saying that the government should just keep spending to keep us out of a downturn/depression.
But no, no-boats Willis knows better, NZ economy is just like a household, the government should be reduced along with its service levels, cancel cancel cancel everything and create an unnecessary depression which I doubt we will see the end of this year.
MMT is old-school Keynesian economics and is based on an understanding of the true role of government deficits. Which is to utilize spare capacity in the private sector to prevent depressions and recessions. Government deficit = an asset in the private sector. Macroeconomics with double entry accounting. The reserve bank - and thus government spending - sit on the opposite side of the ledger to the private sector.
We welcome your comments below. If you are not already registered, please register to comment
Remember we welcome robust, respectful and insightful debate. We don't welcome abusive or defamatory comments and will de-register those repeatedly making such comments. Our current comment policy is here.