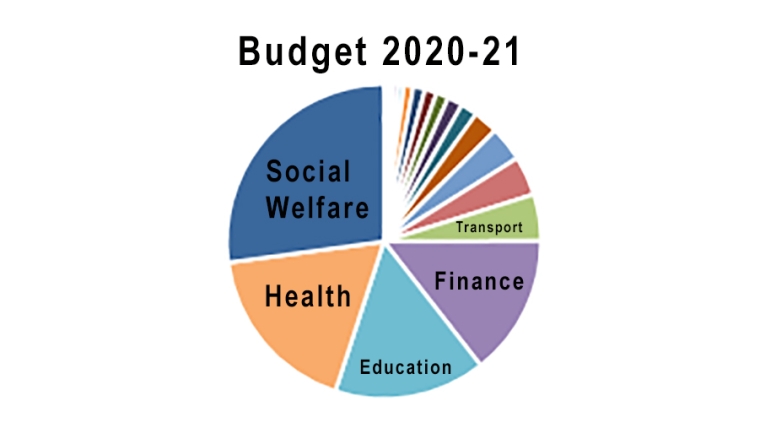
This table outlines the New Zealand Government's planned spending for the 2020/21 budget year.
Actual spending for the previous four years is on the left.
The numbers are drawn together from data released by the Minister of Finance on May 14, 2020.
Links to the primary sources used, from Treasury's website, can be found at the bottom of the page.
Click on any heading to drill down to what makes up these numbers. (Coming soon) Figures for each allocation are in millions of NZ$.
| Actual 2015/16 |
Actual 2016/17 |
Actual 2017/18 |
Actual 2018/19 |
Estimate 2019/20 |
Budget 2020/21 |
% | |
| NZ$m | NZ$m | NZ$m | NZ$m | NZ$m | NZ$m | ||
| 165.1 | Canterbury Earthquake Recovery (old) | ||||||
| 591.4 | 591.0 | 705.1 | 779.4 | 865.3 | Official Development Assistance | ||
| 2.2 | 16.1 | 25.7 | Pike River Re-entry | 7.4 | 0.0% | ||
| 14.8 | 18.1 | 18.7 | 17.7 | 24.1 | Defence Ministry | 23.6 | 0.0% |
| 28.7 | 110.8 | Forestry | 188.5 | 0.1% | |||
| -7.8 | -35.0 | 172.2 | -177.9 | -325.4 | Environment | 194.0 | 0.2% |
| 193.3 | 197.5 | 214.1 | 229.4 | 262.0 | Customs | 262.4 | 0.2% |
| 109.0 | 139.6 | 251.6 | 183.6 | 292.0 | Lands | 271.7 | 0.2% |
| 40.0 | 225.0 | R&D tax incentives | 281.0 | 0.2% | |||
| 274.3 | 319.3 | 284.0 | 329.3 | 380.7 | Arts, Culture and Heritage | 373.3 | 0.3% |
| 240.4 | 291.8 | 306.9 | 336.1 | 413.6 | Maori Development | 382.0 | 0.3% |
| 465.0 | 175.0 | 304.3 | 74.9 | 413.1 | Treaty Negotiations | 406.9 | 0.3% |
| 216.8 | 274.5 | 288.2 | 369.4 | 425.0 | Paid Parental Leave Payments | 455.0 | 0.4% |
| 381.8 | 412.5 | 413.7 | 457.2 | 552.8 | Conservation | 586.6 | 0.5% |
| 554.2 | 561.3 | 544.0 | 552.0 | 680.4 | Justice | 697.7 | 0.5% |
| 536.1 | 548.7 | 591.1 | 618.6 | 715.7 | Courts | 732.4 | 0.6% |
| 555.7 | 624.5 | 687.3 | 684.3 | 792.4 | Internal Affairs | 744.9 | 0.6% |
| 569.9 | 580.8 | 792.2 | 848.7 | 880.6 | Ag, Biosecurity, Fisheries & Food Safety | 853.1 | 0.7% |
| 685.6 | 1,722.7 | 801.8 | 859.9 | 902.0 | KiwiSaver tax credit | 930.0 | 0.7% |
| 727.9 | 793.3 | 841.7 | 848.5 | 926.6 | Govenrment Administration | 1,093.7 | 0.8% |
| 156.6 | 863.8 | 980.0 | 1,209.4 | Oranga Tamariki | 1,372.7 | 1.1% | |
| 1,339.7 | 1,154.7 | 1,210.5 | 1,392.0 | 1,460.0 | Debt writeoffs (incl Student Loans) | 1,438.0 | 1.1% |
| 441.8 | 456.3 | 448.8 | 518.4 | 578.5 | Foreign Affairs | 1,516.5 | 1.2% |
| 5,696.8 | 223.2 | 1,240.3 | 1,302.0 | 1,481.3 | All other IRD/Revenue costs | 1,737.2 | 1.3% |
| 2,257.1 | 1,843.9 | 1,757.7 | Housing and Urban Development | 1,941.6 | 1.5% | ||
| 1,546.0 | 1,604.2 | 1,682.7 | 1,988.0 | 2,063.2 | Police | 2,132.2 | 1.7% |
| 1,448.2 | 1,579.8 | 1,744.3 | 1,734.7 | 1,959.4 | Labour | 2,233.5 | 1.7% |
| 1,543.3 | 1,601.7 | 1,741.3 | 2,176.9 | 2,211.0 | Corrections | 2,429.3 | 1.9% |
| 1,791.2 | 1,725.5 | 2,050.5 | 2,340.4 | 3,589.8 | Business, Science and Innovation | 2,646.8 | 2.1% |
| 2,320.4 | 2,288.5 | 2,165.8 | 2,757.7 | 2,767.0 | Working for Families tax credits | 2,792.0 | 2.2% |
| 2,876.2 | 3,010.8 | 3,141.5 | 3,565.9 | 7,407.8 | Defence Force | 3,971.2 | 3.1% |
| 1,949.3 | 2,006.2 | 3,289.5 | 2,919.1 | 4,302.2 | Transport | 4,750.4 | 3.7% |
| 7,097.4 | 5,307.7 | 5,127.8 | 5,596.5 | 7,566.6 | Finance | 7,638.4 | 5.9% |
| 13,779.6 | 14,100.0 | 14,709.4 | 15,433.3 | 16,377.7 | Education | 17,508.5 | 13.6% |
| 14,651.5 | 17,785.1 | 15,755.9 | 16,869.3 | 18,579.2 | Health | 19,335.4 | 15.0% |
| 23,264.4 | 24,174.4 | 22,081.9 | 24,974.6 | 40,309.4 | Social Welfare | 33,014.2 | 25.6% |
| --------- | -------- | -------- | -------- | -------- | ----------------------------- | --------- | ----- |
| $ 86,219 | $ 89,456 | $ 92,135 | $ 99,868 | $ 130,779 | Total Expenditure | $ 129,109 | 100% |
| $257,702 | $274,612 | $292,897 | $303,287 | $307,229 | GDP (nominal, per RBNZ) | $292,000 | |
| 33.5% | 32.6% | 31.5% | 32.9% | 42.6% | Govt spending as % of GDP | 44.2% | |
| and this compares with taxes collected as follows: | |||||||
| 83,469 | 88,559 | 92,629 | 99,597 | 97,187 | Total Revenues | 93,459 | |
The data in this table is net spending, after fee and charges revenues have been deducted from the gross expenditute planned.
Sources: You can download the data behind these tables from the NZ Government website here.
1 Comments
Putting health as the second most focused on the upcoming budget is good.
New Zealand came in 80th place for hospital beds per capita, with just 280 beds per 100,000 people. That's half of what Croatia had, for example, or a quarter of the beds per capita that second-place Japan has.
It also came 42nd in the ranking of doctors per capita, with 306.1 per 100,000 people, but fared slightly better when it came to nurses and midwives per capita, where it came 16th.
Overall, New Zealand scored 45.7 out of 100 for healthcare capacity, coming in 39th place.
But I think the aiding of the pandemic was a success since there was really no prepared country in the first place.
Looking forward for next year.
Regards from Jack M., (hamilton house cleaning)
We welcome your comments below. If you are not already registered, please register to comment
Remember we welcome robust, respectful and insightful debate. We don't welcome abusive or defamatory comments and will de-register those repeatedly making such comments. Our current comment policy is here.