

In yesterday's Westpac review of inflation and interest rates, they made the following observation:
Another factor is that banks’ funding costs are evolving independently of the OCR. For several years after the financial crisis, growth in deposits was sufficient to meet banks’ funding needs. But in recent months, deposit growth has slowed markedly, at the same time that credit growth has accelerated. In principle, banks can meet this funding shortfall through offshore wholesale markets, but there are limits to how far they can go down this path – partly due to tightening international regulatory requirements, and partly due to cost. If the constraints on funding persist, this will likely manifest as some combination of higher interest rates and tighter lending standards.
Domestic funding growth, underpinned by fast rises in household bank accounts, has been a feature of the current New Zealand economy.
We chart the rise in household deposits here, and the rise in home loan and personal finance borrowing (which includes credit cards) here and here.
These series have shown stronger long run rises for deposits than borrowing. On this basis, banks have been able to get much of their extra funding needs locally.
But of course, there is more to the economy than just households. Business and government are also part of the market that banks service.
Using the RBNZ S6 and S7 series, you can find the overall lending demand and funding supply for New Zealand banks.
And what that shows is that for the past six months, there has been a consistently more lending going on than supply of funding.
And that is a new situation, as this chart shows.
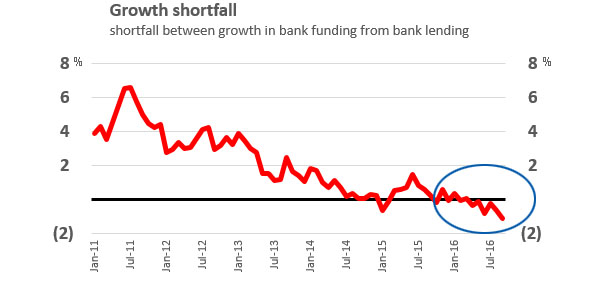
There is no issue when the red line is above zero - in fact when that is the case, banks are oversupplied by savers and can reduce the interest rates they pay savers.
But when the red line is below zero, banks need to find new sources of funding to meet the demand for loans.
To stay within their core funding ratio, and to meet minimum mismatch requirements, banks have started to raise the offer rates to savers. They will be doing much more than this of course, but this is one reason we are seeing higher term deposit rates for longer terms.
The chart above only goes back to 2011, but the data goes back to 2005.
| Annual lending (S7) |
Annual funding (S6) |
Loan growth |
Funding growth |
variance | |
| $ bln | $ bln | %pa | %pa | % | |
| Sep-05 | 221.8 | 164.7 | |||
| Sep-06 | 245.9 | 183.9 | +11.0 | +12.5 | +1.5 |
| Sep-07 | 281.3 | 206.1 | +14.4 | +12.1 | - 2.3 |
| Sep-08 | 308.4 | 220.0 | +9.6 | +6.7 | - 2.9 |
| Sep-09 | 315.0 | 230.7 | +2.1 | +4.9 | +2.8 |
| Sep-10 | 315.4 | 225.0 | +0.1 | - 2.5 | - 2.6 |
| Sep-11 | 321.5 | 240.6 | +1.9 | +6.9 | +5.0 |
| Sep-12 | 331.4 | 255.0 | +3.1 | +6.0 | +2.9 |
| Sep-13 | 350.3 | 276.0 | +5.7 | +8.2 | +2.5 |
| Sep-14 | 364.4 | 287.0 | +4.0 | +4.0 | +0.0 |
| Sep-15 | 394.2 | 311.2 | +8.2 | +8.4 | +0.2 |
| Oct-15 | 399.7 | 312.9 | +8.6 | +8.4 | - 0.2 |
| Nov-15 | 403.4 | 319.2 | +8.6 | +9.2 | +0.5 |
| Dec-15 | 404.4 | 319.7 | +8.8 | +8.7 | - 0.1 |
| Jan-16 | 407.3 | 320.0 | +8.5 | +8.8 | +0.3 |
| Feb-16 | 407.5 | 321.8 | +8.7 | +8.6 | - 0.1 |
| Mar-16 | 410.7 | 325.5 | +9.0 | +9.0 | +0.0 |
| Apr-16 | 416.6 | 330.6 | +9.9 | +9.5 | - 0.4 |
| May-16 | 418.3 | 330.3 | +9.2 | +9.1 | - 0.2 |
| Jun-16 | 418.1 | 330.2 | +7.4 | +6.6 | - 0.8 |
| Jul-16 | 418.9 | 330.8 | +7.7 | +7.4 | - 0.3 |
| Aug-16 | 422.0 | 332.5 | +8.1 | +7.5 | - 0.7 |
| Sep-16 | 423.1 | 330.5 | +7.3 | +6.2 | - 1.1 |
There have been consistent shortfalls for most of 2016. In fact, the -3.3% drop in the nine months of 2016 so far is greater than any negative annual change since the start of this data.
In the year to September 2016, funding levels have grown by just +$20 bln while lending levels have grown +$30 bln.
Even for New Zealand bank treasurers, this -$10 bln shortfall is a concern and needs to be addressed.
This may be one reason we are seeing a turn in the market to favour savers over borrowers.
And it may be a reason we are seeing a tightening in lending standards by banks.
Bank margins may not be the real driver. This same data discloses "average monthly weighted interest rates" for both series, and you can plot the difference between them too, as per this chart.
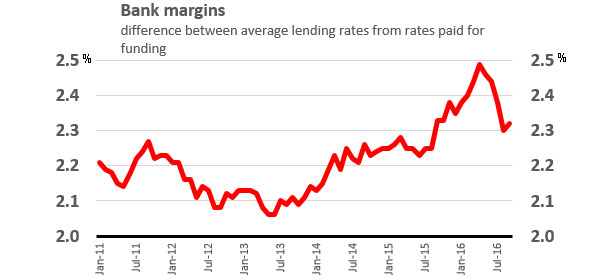
Margins aren't the issue. But the level of funding available to meet the loan demand is.
We welcome your comments below. If you are not already registered, please register to comment
Remember we welcome robust, respectful and insightful debate. We don't welcome abusive or defamatory comments and will de-register those repeatedly making such comments. Our current comment policy is here.