

This Top 5 comes from interest.co.nz's Gareth Vaughan.
As always, we welcome your additions in the comments below or via email to david.chaston@interest.co.nz. And if you're interested in contributing the occasional Top 5 yourself, contact gareth.vaughan@interest.co.nz.
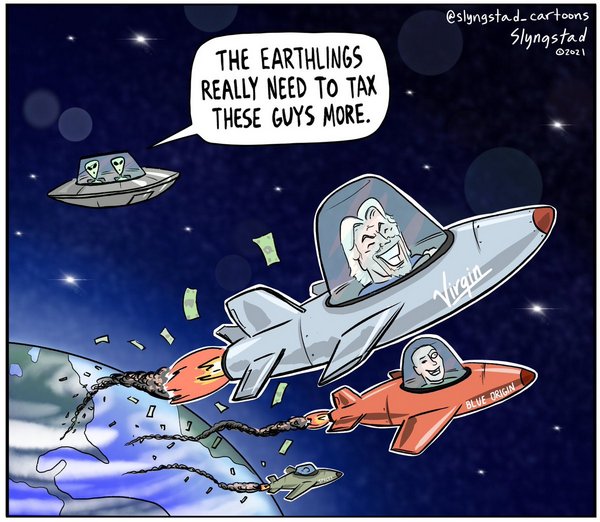
Cartoon: Benjamin Slyngstad.
1) The Limits to Growth, 49 years on.
I stumbled across this update to the 1972 book Limits to Growth via, of all places, a Daily Mail article on social media. As the Daily Mail explains;
In 1972, a team from the Massachusetts Institute of Technology (MIT) predicted that humanity's pursuit of economic growth without regard for environmental and society costs would lead to society collapsing by the mid 21st century – a new study finds this may become a reality.
The Limits to Growth update comes from KPMG director Gaya Herrington, who published research in the Yale Journal of Industrial Ecology comparing the World3 model, created in the 1970’s by the MIT scientists, with empirical data. Herrington asks what happens if humanity keeps pursuing economic growth without regard for environmental and social costs?
The World3 model was used to study key interactions between variables for global population, birth rate, mortality, industrial output, food production, health and education services, non-renewable natural resources, and pollution.
Here's Herrington's abstract, or scene setter.
In the 1972 bestseller Limits to Growth (LtG), the authors concluded that, if global society kept pursuing economic growth, it would experience a decline in food production, industrial output, and ultimately population, within this century. The LtG authors used a system dynamics model to study interactions between global variables, varying model assumptions to generate different scenarios. Previous empirical-data comparisons since then by Turner showed closest alignment with a scenario that ended in collapse. This research constitutes a data update to LtG, by examining to what extent empirical data aligned with four LtG scenarios spanning a range of technological, resource, and societal assumptions. The research benefited from improved data availability since the previous updates and included a scenario and two variables that had not been part of previous comparisons. The two scenarios aligning most closely with observed data indicate a halt in welfare, food, and industrial production over the next decade or so, which puts into question the suitability of continuous economic growth as humanity’s goal in the twenty-first century. Both scenarios also indicate subsequent declines in these variables, but only one—where declines are caused by pollution— depicts a collapse. The scenario that aligned most closely in earlier comparisons was not amongst the two closest aligning scenarios in this research. The scenario with the smallest declines aligned least with empirical data; however, absolute differences were often not yet large. The four scenarios diverge significantly more after 2020, suggesting that the window to align with this last scenario is closing.
And here's her conclusion.
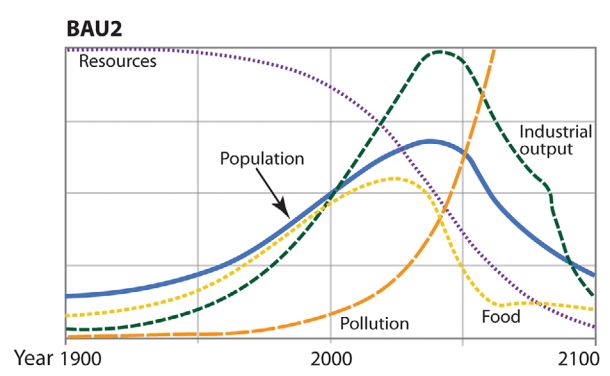
Empirical world data was compared against scenarios from the last LtG [Limits to Growth] book, created by the World3 model. The data comparison, which used the latest World3 version, included four scenarios: BAU [business as Usual], BAU2 [business as usual 2], CT [comprehensive technology], and SW [stabilized world]. Empirical data showed a relatively close fit for most of the variables. This was true to some extent for all scenarios, because in several cases the scenarios do not significantly diverge until 2020. When scenarios had started to diverge, the ones that aligned closest with empirical data most often were BAU2 and CT. This result is different to previous comparisons that used the earlier World3 version, and which indicated BAU as the most closely followed scenario. The scenario that depicts the smallest declines in economic output, SW, is also the one that aligned least closely with observed data. Furthermore, the two closest aligning scenarios BAU2 and CT, respectively, predict a collapse pattern and moderate decline in output. At this point therefore, the data most aligns with the CT and BAU2 scenarios which indicate a slowdown and eventual halt in growth within the next decade or so, but World3 leaves open whether the subsequent decline will constitute a collapse. World3 also indicates the possibility, for now, of limiting declines to less than in the CT. Although SW tracks least closely, a deliberate trajectory change brought about by society turning toward another goal than growth is still possible. The LtG work implies that this window of opportunity is closing fast.
The Daily Mail article links to this 1970s video explaining the model.
Writing for Rolling Stone, Zoe Bernard has great colour and characters from Bitcoin 2021, a two-day conference in Miami earlier this northern summer.
Inside the conference, there’s the sort of ansty energy you might expect from people who’ve spent the past year pent up at home, relegated to communicating from behind handles like @boner4bitcoin over Twitter DMs and in Telegram groups.
Now, we’re gathered together in three-dimensional space, surrounded by these same internet denizens, unmasked in stark physicality. To be part of a crowd is something many of us are experiencing for the first time in more than a year, and it is intoxicating.
The room is dark, except for the orange glow emanating from the video-screen backdrop of a dump-truck-size Bitcoin cropping up from a sandy beach. Behind the Bitcoin, animated palm trees sway in an animated breeze. Ron Paul, the former congressman, is onstage speaking about monetary freedom.
“We love you!” someone in the audience screams.
In the hazy light, I scan the crowd. Their faces are upturned in rapt attention. I’ve seen this reverential expression in an audience before, albeit in a different context.
It reminds me, unmistakably, of church.
Here's more on the aforementioned @boner4bitcoin.
Another man, who wears a yellow bandana over a head of soft, dark curls, who also asks to be identified by his Twitter handle, @boner4bitcoin, says that he was in a dark place before stumbling upon the Bitcoin community last year. Then, he was a junkie, he says.
While it was not by the saving grace of Bitcoin alone that he renounced the junkie lifestyle, it was a decisive influence in changing his life for the better. Now, he is supported by a network of people who are providing a financial education that he “couldn’t learn in college.”
Bitcoin changed @boner4bitcoin’s outlook from what he calls the “instant-gratification lifestyle” to one focused on long-term rewards.
“I jumped in thinking I was gonna ride this out in 2017 and make a couple bucks like a dogecoin boy. Now I operate in a totally different way, and it’s all for the better,” he says. “There’s nothing negative. If you ask my wife, she’ll give you a 10 out of 20.”
Bitcoin, everyone tells me emphatically, isn’t internet-money intended to get you rich. Instead, it’s a “way of life,” says Jacob, a man with dusty-blonde hair and an infectious smile who runs a Bitcoin community in Charlotte, North Carolina. To Jacob, who describes himself as a Bitcoin evangelist, telling people about Bitcoin is like “giving them the Word,” he says. “It’s like, ‘This is a good thing. Let me help you.’ ”
Unsurprisingly the conference organisers are no fans of fiat currency.
To better illustrate the futility of fiat currency, an enormous dumpster filled with Venezualan bolivars, the world’s weakest form of money due to hyperinflation, has been centrally placed on a patch of cracked asphalt. Because there are not enough bills to fill the dumpster in a way that would visually embody the message of “cash is trash,” the bottom is padded with actual garbage, and by midafternoon, a sickly-sour odor lingers in the air.

Cartoon: Brian Adcock, The Independent.
3) Will China's economy overtake the US?
Writing for Bloomberg, Eric Zhu and Tom Orlik take a look at when China will overtake the US to become the world’s biggest economy. They conclude it might not.
Over the long haul, three factors determine an economy’s growth rate. The first is the size of the workforce. The second is the capital stock—everything from factories to transport infrastructure to communication networks. Finally there’s productivity, or how effectively those first two can be combined.
In each of these areas, China faces an uncertain future.
Then there's the authoritarian rule of President Xi Jinping, and what impact that might have.
...Xi has the logic of development on his side. China’s 1.4 billion population is four times larger than that of the U.S. GDP per capita is currently less than 20% of the level in the U.S. It would only have to converge a little more for China to claim the top spot. China’s past development success, as well as that of Asian neighbors Japan and South Korea, suggest that shouldn’t be too tall an order.
But as the checkered history of the China’s last hundred years shows, development is not pre-destined. At the 100-year anniversary the focus— understandably—is on the successes of the last forty years. In the earlier decades, the Party’s record on delivering growth was—to say the least—much less impressive. As Xi casts off the constraint of term limits and prepares for a third term as President, some fear a return of the leadership dysfunctions that blighted the earlier period of Communist rule.
4) The Bank of Japan's 0% climate change loans.
In previous Top 5s I've included articles about the Bank of Japan (BoJ) and how its monetary policy is way beyond anything the Reserve Bank of New Zealand (RBNZ) has been doing. The BoJ's activity includes the likes of buying exchange-traded funds and Japan real estate investment trusts, plus undertaking QQE, or Qualitative Monetary Easing.
Now the BoJ is introducing loans to support private financial institutions' efforts to combat climate change. The interest rate? 0%. The BoJ says funds will be provided against those that contribute to Japan's actions to address climate change. These may include green loans/bonds, sustainability-linked loans/bonds with performance targets related to efforts on climate change, and transition finance. Funds will be provided for one year in principle, the BoJ says.
Climate change could exert an extremely large impact on developments in economic activity and prices as well as financial conditions from a medium- to long-term perspective. Supporting the private sector's efforts on climate change from a central bank standpoint will contribute to stabilizing the macro economy in the long run. In taking actions from the monetary policy side, the Bank deems it appropriate to give consideration to market neutrality, avoiding direct involvement in micro-level resource allocation as much as possible.
From these perspectives, the Bank decided to introduce a new fund-provisioning measure so that financial institutions that disclose a certain level of information on their efforts to address climate change can receive funds from the Bank against their investment or loans made as part of such efforts. It will launch the measure likely within 2021.
I can already hear the howls of protest from the RBNZ's right-wing critics should it follow suit...
5) How OCR hikes will benefit the Aussie banks.
Morgan Stanley banking analysts have crunched the numbers on what impact they expect RBNZ Official Cash Rate (OCR) increases will have on the big banks' margins. Hint: It's not negative.
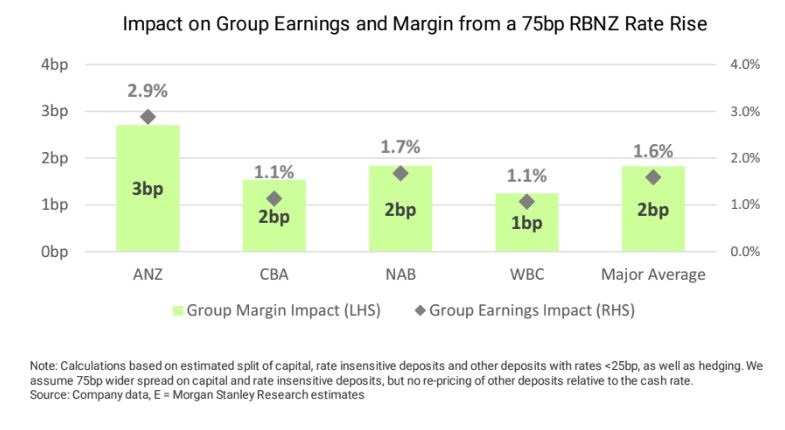
Being Australian-based, Morgan Stanley looks at it from the perspective of the parents of NZ's big four banks. For ANZ, which has easily the largest NZ exposure of the Aussie banks, they reckon 75 basis points worth of OCR increases by mid-2022 would increase group margin by three basis points with potential for a further modest benefit from deposit re-pricing. That means deposit rate increases lagging OCR hikes.
The majors have a total of A$220 billion of capital and low cost deposits in New Zealand, including A$40bn of capital, A$110bn of rate insensitive deposits and A$70bn of "other" deposits and savings accounts with rates below 25 basis points, based on first-half 2021 disclosures. We estimate that NZ accounts for 30% of ANZ's low rate deposits, but only 10% to 15% at the other majors. With 35% to 40% of balances hedged, we believe that 75 basis points of RBNZ rate rises by the middle of 2022 would add an average of 2 basis points to the major banks margins (ANZ: 3bp; CBA 1.5bp; NAB: 2bp; WBC: 1bp).
Potential deposit re-pricing: While advertised 3-month and 6-month term deposit rates in NZ are still 35bp and 80bp to 100bp, respectively, rates for the majors' other savings accounts are below 25bp. As such, we see scope for deposit re-pricing, with any increase in rates on "other" low cost deposits and savings accounts likely to lag the RBNZ's cash rate hikes. While this would provide a further margin tailwind in NZ, the potential impact on group margins is modest, as every 50bp of re-pricing on the "other" low cost deposits adds only 1bp to group margins at ANZ and less at the other majors.
The Covid Olympics.#AFPgraphics factfile on the provisions set for the Tokyo #Olympics to minimise risk of Covid-19 pic.twitter.com/J5ewvmeC4v
— AFP News Agency (@AFP) July 20, 2021
31 Comments
"Limits to Growth" should be required reading. Donella Meadows was a brilliant systems thinker, and another book of hers, "Thinking in Systems: A Primer" is very much worth a look too. Once you understand a few basic concepts of systems thinking (which she is very good at explaining btw), you come to realise how absolutely psychopathic our current trajectory really is.
I believe PDK needs the credit for that article - he posted the link last week. The man should be briefing all new politicians and be a sought after speaker at business conferences. But hey they prefer washed up sports stars.
I didn't see PDK's link. But when I saw the article I did think it would be of interest to him!
PDK is a decade or more ahead of most of us so no shame in that!
Gareth: It was No7
https://www.interest.co.nz/opinion/109409/powerdownkiwi-marks-his-ten%C…
I sent it to you more than 3 weeks before Easter. Interest.co chose to put it up late Easter Monday.............
Jason Hickel's 'How degrowth will save the world' is a great modern day supplement to LtG.
I've never read limits to growth but I read the latter book, Systems Thinking, and enjoyed it. However the world is far too complex to be reduced to holistic views or vice versa. We must instead put our big boy pants on and accept rigorous multidimensional analysis of dynamic systems as inevitable if we are to do more than sift tea leaves.
I'll save you some trouble. The main points to take away from it are:
- compound growth is exponential growth
- exponential growth is unsustainable
- the opposite of "sustainable" is "terminal"
Given we measure success in terms of compound growth, then, either we're consciously pursuing a strategy where eventual catestrophic failure is baked-in-the-cake, or we've chosen to bury our heads in the sand and pretend that we can carry on like this forever.
Not sure it takes any special multidimensional analysis to realise that.
The trouble is so many will deny the existence of the problem of our overshot predicament.
The latest form of this shows itself as pledges to do something in the future, whilst doing nothing today.
BAU indeed with the inevitable terrifying consequences.
There seems to be a historic bias towards forecasting catastrophic scenarios. It might be just as pressing to enquire as to what humans misunderstand about systems.
There's a rather large deficit in food relative to population from around 2030 onwards. It could be addressed by reducing food waste and over-consumption in wealthy countries, but I guess not.
Saw a documentary recently that claimed food wastage isn't going anywhere because large corporations can profit more around pushing more volumes of fresh foods through well-established supply chains instead of investing in new ones.
It's important to remember that the LTG wasn't about trying to predict an exact timeline of events. Basically they just tried modeling various scenarios to see if any suggested continuous economic growth was possible without significant harm. Basically all of the scenarios they modelled (with altered variables) wound up with eventual resource depletion and subsequent ecological collapse. Only limiting population and reducing consumption significantly gave a long-term positive outcome for humanity.
It's funny how this view was belittled circa 2008 when PDK started to share this view, yet 10 years later it's apparent real economic growth (actual increased prosperity and living standards in the first-world) has vanished and is seemingly starting to reverse for the young.
Just wait until resource scarcity increases further. Should be a fun time ahead over the next couple of decades.
Strikes me it is a race between resource depletion, tech change and young people not being able to afford more than 1 kid.
What does that end up looking like?
1) Robots pottering away making less stuff with less resources for a dwindling pet human population?
2) Road Warrior?
#5 is a good reminder of the vested interests at stake when bank economists suggest the RBNZ should raise the OCR sooner
YES
An OCR increase by 0.75 points would only increase group margin by three basis points, according to this report. So not a great bonus for banks.
Most importantly, we should not forget that a sorely needed significant increase to the OCR is necessary not for the sake of the banking system, but for the sake of the longer term economic and social health and balanced growth of the NZ economy. Self-serving, vested-interest complaints by housing specuvestors should be completely ignored.
The Church and the Charismatics
missionaries and fanatics
In the deep south a revivalist meeting is in progress. A charismatic evangelist fires up the congregation with fire and brimstone. Many see the "light" and become immediate devotees. In a state of heightened fervour, the congregation contribute generously as the collection plate is passed around.
chartists and fanatics (and coiners)
In the far north, a charting seminar is in progress. A charismatic presenter fires up the congregation with promises of untold wealth and riches. Novices learn charting is the light and the way. Convinced they have found salvation and the holy grail. In a state of heightened expectation the congregation contribute generously. Signing on for the never-ending journey to "el-dorado" and "valhalla".
Will the media ever accept that the Olympics are going to happen - are happening - ?
Or will they protest all the way through?
The "biggest waste of Space" is not taxing those Climate Billionaires whose Ego is bigger than mine and who Thunk that a total waste of Climate Fix is what they were put on Earth to achieve.
Virgin on the ridiculous that a Giant Leap forwards for Mankind, will probably fix Flooding, Wind, Rain, Cow Crap, Human Excrement, and all waste of money, ever invented to contain the Products of the waste of all Humanity, from Top to Bottom.
Maybe Jacinda could waste even more Money in all she Surveys and see the bleedin obvious.
https://www.msn.com/en-nz/news/national/poll-driven-pm-250k-on-covid-su….
More people are likely to be killed by those in Charge in all walks of life, in the near Future, by what they didn't achieve, in the Total Waste of Space, all these billionaires, Millionaires and Politicians and Bankers, screwed UP.....not fixed, Pandering to the Rich and Infamous...including The Mobs.
Oh! and a Police Chief, who cannot see the Obvious. Search any Gangs Palaces and remove all Tax Free and Purloined Wealth and cars and Guns...in one Fell Swoop. Use the Army if necessary and the Equipment contained therein.
Us Poor citizens have had enuff. Stop wasting our Hard Earned Munny.
Tax the Obvious, not every Cent we earn to pay our inflated Bills.
I shall say no more. Waste of Space here.....Waste of Fuel in Space...Waste of Time at the Top........Middle has been diddled for Long Enuff.
DP
Bezos was a joke this morning.
"The Earth is fragile" ............. " we need to build a ladder to space; send all out polluting manufacturing up there"
WTF? any idea how much energy is required to lift how much tonnage ex gravity? Nuts. Cognitive Dissonance, writ large.
pdk,
I was in the car-an EV- when I heard Bezos say that. I just burst out laughing, but then thought-he's probably being serious.
I'm sceptical like the media...cancelled by Saturday my call (foolish to even attempt to run it this year)
Fun to watch, but a waste of public money. Happy for individuals to pursue their personal goals but claiming national glory based on individual effort is pathetic.
M B,
How about the Japanese themselves? Lots of them don't seem to want this circus.
Re. number 4, the US is losing its trade links with the world while China is increasing theirs.
https://twitter.com/ianbremmer/status/1416822569894809601?s=20
Man has always grapple with the idea of limits since cilvilisation.
Here's the definition limits; always approaching but never arrive.
Ah, no and no.
Civilisation has irrupted many times - and every time has hit limits, and collapsed. In every case, a resource/energy/popuation/overshoot/collapse story is told.
This is the first - and only possible - time it has been run globally. Fertile Crescent, Planet. Just a difference in scale.
Not sure on that PDK. While the current run of our species likes to think itself as supreme, there is quite a bit of evidence that we are not the first age of man, and that we have managed to do this to ourselves before, not once, but several times. The problem with that is each time society collapses globally, all the lessons as to why it collapsed gets lost too, or alternatively they are encased into cryptic myth which is conventionally and conveniently dismissed.
No wonder Westpac gave up the plan to float the NZ subsidiary here in NZX.
We welcome your comments below. If you are not already registered, please register to comment
Remember we welcome robust, respectful and insightful debate. We don't welcome abusive or defamatory comments and will de-register those repeatedly making such comments. Our current comment policy is here.