

By Martien Lubberink*
 Earlier this month, the Australian prudential regulator and our Reserve Bank published their views on the resilience of the banks they supervise.
APRA’s Wayne Byres cautioned his audience: yes, Australian banks are resilient, but only just.
They will struggle in a housing market downturn.
In fact, if you read between the lines of Byres’ speech, you will notice that Australian banks just managed to scrape through the latest stress tests.
Our Reserve Bank, however, is much more upbeat and confident.
This month’s Financial Stability Report commends our banks for capital levels that are well above regulatory minima. New Zealand’s banks are resilient, profitable, and healthy.
This worries me.
How can New Zealand’s banks be healthy while their counterparts across the Tasman are fragile?
I don’t think they can.
There are three reasons why our banks are probably more fragile than our Reserve Bank wants us to believe.
First is that similar circumstances dictate similar policy responses, second is the capitalisation of banks elsewhere, and third is the way the Australian parent banks of our big-four banks manage capital.
Similar conditions, different policy responses?
Conditions in both countries are similar, in particular with respect to house prices. These are elevated, and we know that booming house prices predict prolonged economic badness. APRA’s Byres notices that the proportion of lending attributable to housing has increased significantly over the last ten years. This trend shows up in the growth of the risk-based solvency ratio over the (simple) leverage ratio. The trend also shows up in a drop of the ratio of Risk Weighted Assets to Total Assets. This is because supervisors regard housing loans as low-risk loans.
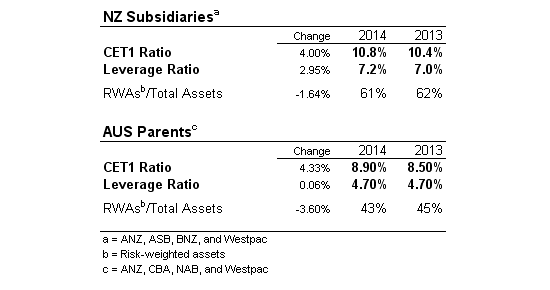
The table below, which compares data from our big-four banks and their Australian parents,shows that the ratios behaved similarly for both New Zealand and Australia.*
In both countries, the growth of the risk-based ratio (CET1 Ratio) over the last year outpaced the growth of the leverage ratio. In addition, the ratio of Risk-Weighted Assets to Total Assets decreased for both countries.
In a response to this trend, Wayne Byres uses firm language to demonstrate that he takes the risks of the housing sector serious. He promises to keep the health of banks’ housing portfolios under considerable scrutiny.
Our Reserve Bank’s response is much more modest. Yes, it identifies the risks of the housing sector. However, it relies on the LVR restrictions. These have done some good work to stabilise housing prices, but did not prevent growth in household lending (5%) to outpace GDP growth (3.5%). The Reserve Bank’s modest response may rely on the comfortably high capital ratios. But are these ratios really that high?
Other countries’ capital ratios
New Zealand capital ratios are just on par with Europe, where banks are still recovering from the GFC. For example, the New Zealand CET ratio of 10.8% is just above the European average CET1 ratio of 10.1%, reported on a fully implemented Basel III base. EU countries that are comparable to New Zealand, e.g. Denmark, Finland, Norway, and Sweden report an average CET1 ratio of 15% (!)
In addition, the Reserve Bank refers to an awkward CET1 benchmark ratio when it concludes that our banks are well capitalised. It refers to the 4.5% minimum CET1 ratio requirement. However, in normal circumstances the benchmark should be 7%, a ratio that includes the 2.5% conservation buffer on top of the 4.5% minimum. Moreover, the Reserve Bank’s Financial Stability Report reveals that this year’s stress tests made banks dip into the conservation buffer: Under stress, CET1 ratios would drop by 3%, which presents an ominous sign of bank resilience.
Capital management
My last worry for now is that Australian parent banks likely manage the location of capital and respond to high requirements imposed on them by our Reserve Bank. They may move capital from home to host, from Australia to New Zealand. As a consequence, the home banks look poorly capitalised, but their New Zealand subsidiaries look healthy.**
The table above shows exactly this. Where New Zealand banks report healthy solvency ratios, the parent holding banks look feeble. Note the differences: The average New Zealand CET1 ratio for 2014 is almost 2% higher than its Australian counterpart (10.8% versus 8.9%). The New Zealand leverage ratio is also significantly higher.
Because of capital management, the Kiwi capitalisation ratios are probably deceptively high. They may reflect requirements imposed on them by our Reserve Bank. If that is the case, then New Zealand subsidiaries are just sufficiently capitalised, not “well above regulatory minima.” In case our Reserve Bank does not impose high requirements or restrictions on capital transfers, the Australian parent banks will find ways to repatriate capital. Given the poor performance of Australian banks in the latest stress test, this may happen sooner rather than later. As a result, the New Zealand subsidiaries may end up having less capital soon.
--------------------------------------------------------
* For this table to calculate the ratios, I summed the total amounts of CET1 capital, Tier 1 capital, Risk Weighted Assets (RWA’s) and Total Assets of ANZ, ASB, BNZ, and Westpac and their respective parent companies: ANZ, CBA, NAB, and Westpac. I used data from June 2014 and June 2013, from the banks disclosure statements and annual reports.
** A complicated procedure called “prudential consolidation” combines the capital positions of all subsidiaries into a consolidated capital position, which the table reports for the parent banks in the lower part of the table.
--------------------------------------------------------
*Dr Martien Lubberink is an Associate Professor in the School of Accounting and Commercial Law at Victoria University. He has worked the the central bank of the Netherlands where he contributed to the development of new regulatory capital standards and regulatory capital disclosure standards for banks worldwide and for banks in Europe (Basel III and CRD IV respectively).
We welcome your comments below. If you are not already registered, please register to comment
Remember we welcome robust, respectful and insightful debate. We don't welcome abusive or defamatory comments and will de-register those repeatedly making such comments. Our current comment policy is here.