
This content is sourced from the World Gold Council.
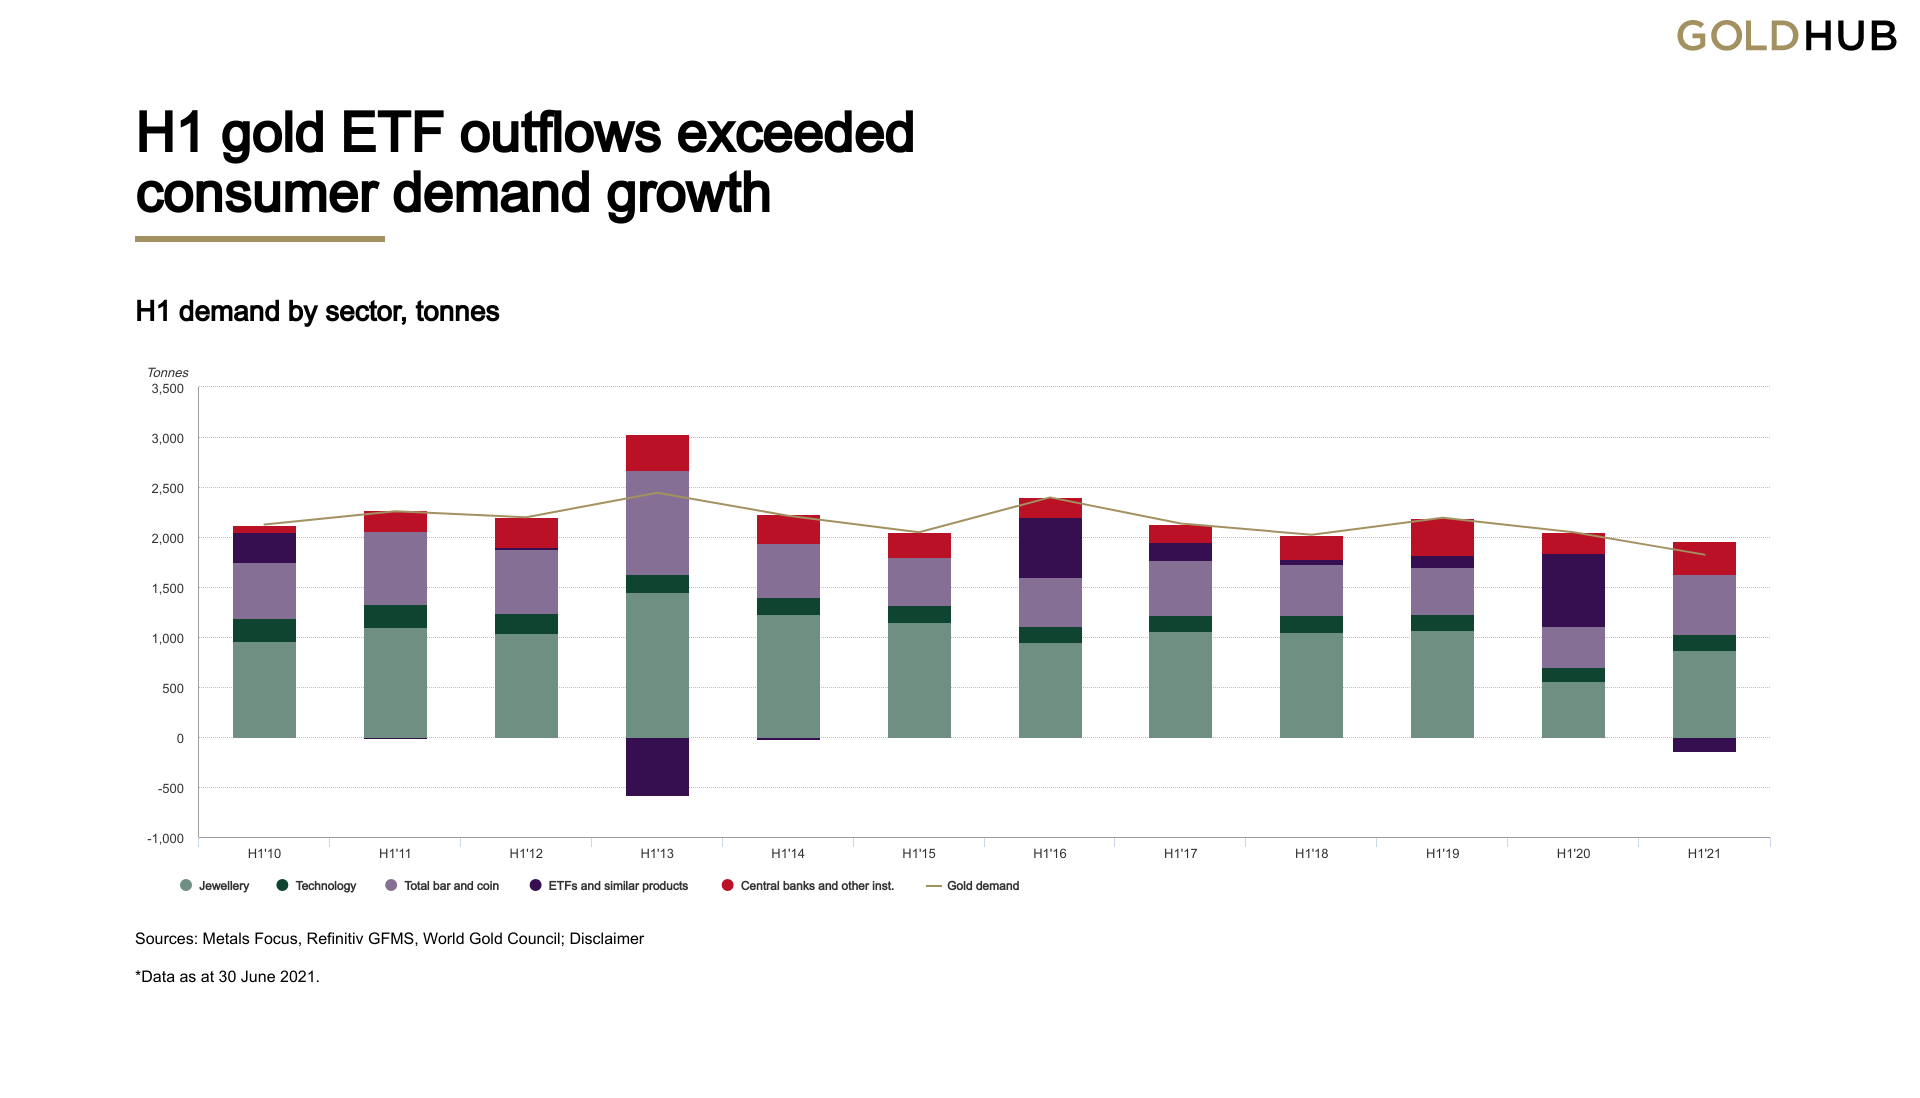
Gold demand (excluding OTC) for Q2 was virtually in line with Q2 2020 at 955.1t (-1%). That took H1 demand to 1,833.1t, down 10% y-o-y.
Q2 jewellery demand (390.7t) continued to rebound from 2020’s COVID-hit weakness, although remained well below typical pre-pandemic levels, partly due to weaker Indian demand growth. Demand for H1, at 873.7t, was 17% below the 2015-2019 average.
Bar and coin investment saw a fourth consecutive quarter of strong year-on-year gains: Q2 demand of 243.8 resulted in a H1 total of 594.t, the strongest since 2013.
Modest Q2 inflows into gold-backed ETFs (40.7t) only partly offset the heavy outflows from Q1; consequently, ETFs saw H1 net outflows (of 129.3t) for the first time since 2014.
Central bank buying continued in Q2. Global gold reserves grew by 199.9t, which took H1 net buying to 333.2t – 39% higher than the five-year H1 average, and 29% above the ten-year H1 average.
Gold used in technology continued to recover from the 2020 lows: Q2 demand was 18% higher y-o-y at 80t – in line with average Q2 demand from 2015-2019 of 81.8t. H1 demand (161t) was fractionally above that of H1 2019 (160.6t).

Q2 inflows into global gold ETFs only partly offset Q1 outflows.

Q2 was the fourth consecutive quarter of strong year-on-year growth in bar and coin investment, 56% higher at 244t.

While jewellery demand continued to recover from the COVID-hit weakness of 2020, it remained well below average pre-pandemic levels.
Highlights
Global gold ETF saw inflows of 40.7 tonnes (t) (US$2.5 billion (bn)) in Q2. Inflows were concentrated in Western markets, with US, Germany and France all seeing double-digit tonnage growth in holdings.
The US dollar gold price averaged US$1,816.5/oz during Q2, 6% higher than in Q2 2020.1 During the quarter, the price gained 4.3%, gaining support from ETF inflows and net long positioning.
Q2 bar and coin investment increased 56% y-o-y. Thailand was the largest contributor to this growth after switching from net negative investment in Q2 2020 to modest positive investment.
Jewellery demand extended its recovery but remains relatively soft. Demand continued to normalise from 2020’s anomalous levels but has yet to return to longer-term average levels.
Global central bank net buying reached 200t in Q2. Large-scale purchases by Thailand, Hungary and Brazil drove this growth in global gold reserves.
Total Q2 gold supply was 13% higher y-o-y; H1 was 4% higher. The industry experienced far less COVID-related disruption than in Q2 2020 – the most interrupted quarter last year.
- All price references based on the LBMA Gold Price PM USD as of the end of the corresponding period unless otherwise noted.
 Our free weekly precious metals email brings you weekly news of interest to precious metals investors, plus a comprehensive list of gold and silver buy and sell prices.
To subscribe to our weekly precious metals email, enter your email address here. It's free.
Comparative pricing
You can find our independent comparative pricing for bullion, coins, and used 'scrap' in both US dollars and New Zealand dollars which are updated on a daily basis here »
We welcome your comments below. If you are not already registered, please register to comment
Remember we welcome robust, respectful and insightful debate. We don't welcome abusive or defamatory comments and will de-register those repeatedly making such comments. Our current comment policy is here.