| Count | Max length | |
|---|---|---|
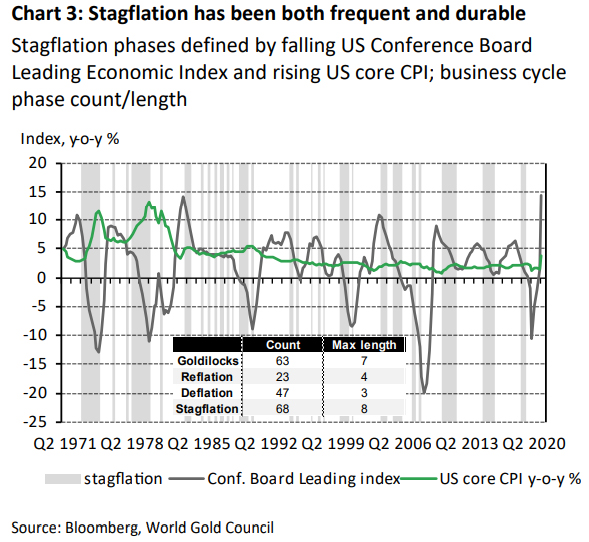
| Goldilocks | 63 | 7 |
| Reflation | 23 | 4 |
| Deflation | 47 | 3 |
| Stagflation | 68 | 8 |
Personal Finance
Even mild stagflation can damage asset values and investors should be wary, even gold investors, warns the World Gold Council
16th Oct 21, 12:15pm
by
This content is sourced from the World Gold Council.
Over the past two months, economic growth has disappointed even as inflation has exceeded expectations. A real risk of stagflationary conditions, with rising costs amid lower growth, appears to be on the cards.
Stagflation, if severe, can be damaging to both the economy and financial markets. But we don’t need a repeat of the 1970s for assets to be affected. Our analysis shows that even mild stagflationary conditions can have similar asset impacts to those in more severe stagflations.
Stagflation has historically hit equities hard. Fixed income returns have been variable, while both commodities and gold have fared well. Gold’s historically strong performance can be attributed to:
-
higher inflation and market volatility– supporting capital preservation motives.
-
lower real interest rates – supporting both opportunity cost and growth risk motives.
But we caution against prescriptively applying historical performance to future expectations. Some additional considerations are:
-
Gold’s strong performance since 2018 could be a headwind, but our analysis shows that it need not be
-
Gold hasn’t benefited from record-low real rates and high inflation in 2021. We believe this has to do with rosy expectations about inflation, growth and equities
-
Record low yields might constrain bonds’ hedging potential in a risk-off event, offering gold an opportunity to command some of those defensive flows, should a shock to risk assets materialise.
Data warns of stagflation
Following a rampant first half in 2021, economic growth may be rolling over in the US and elsewhere. But inflation remains a lingering, if not growing, concern. Economic data started surprising to the downside in August even as inflation data kept their upside surprises (Chart 1).
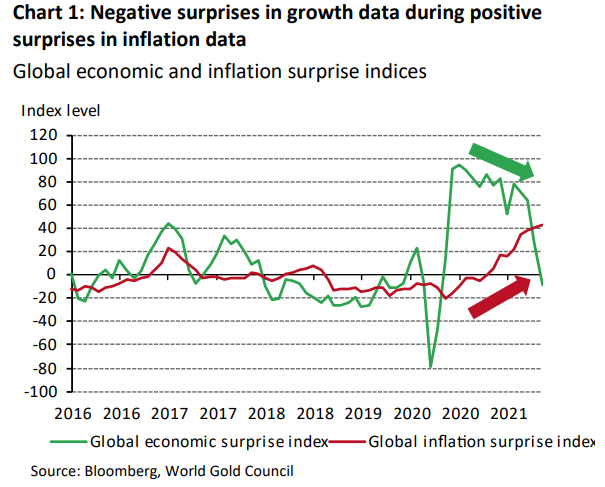
GDP is a lagging indicator so it’s perhaps a little premature to determine the outcome for the official measure of global growth. But there are early indications of a slowdown, from China’s PMI to Germany’s ZEW to the Conference Board Indicators in the US.1
In our view, much of this weakness can be attributed to fears over new variants of COVID-19 and global supply shocks hampering activity. These shocks are also contributing to the elevated inflation prints we’ve experienced over the last few months. Higher commodity prices, fewer workers, a shortage of parts, and sticky global distribution channels are among the factors pushing up inflation rates to multi-decade highs.
Globally, this combination of increasing price pressure and potentially slower growth points towards a stagflationary environment in Q3 2021.
Since the onset of the COVID-19 pandemic, the economy has moved through all four phases of the business cycle (goldilocks, stagflation, deflation and reflation) as defined by the evolution of output and prices. But while the goldilocks and brief stagflation periods at the start of 2020 were mild, a sharp deflation was followed by an equally powerful reflation in the latter part of the year (Chart 2).
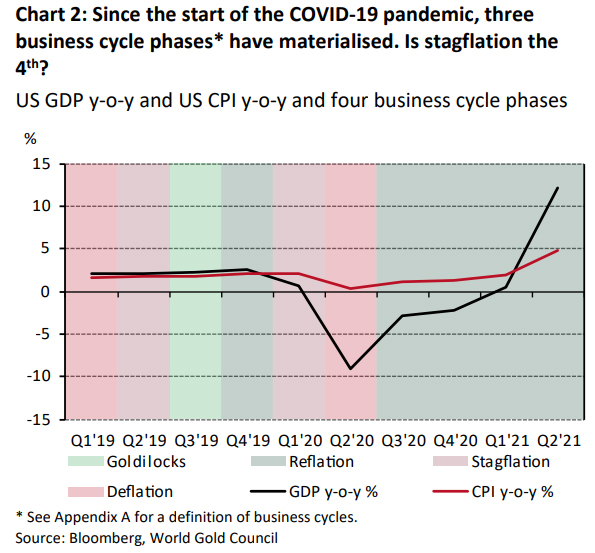
Are we now heading towards a comparably powerful stagflation phase? We dissected history into these four phases, to get insights into what they have meant for asset returns in the past and perhaps what they might mean going forward.
Stagflation can hurt the economy and financial assets
Stagflation can be defined as a slowdown in growth with relatively high unemployment, during a rise in inflation.2 However, this simple definition creates potential limitations. In every recession experienced by the US since 1969,3 the US’s monthly inflation has been in the positive on a y-o-y basis save for a few instances in 2009 and 2015.4
The lack of deflationary pressure in the US in past decades thus complicates our analysis of asset performance in different economic cycles.
To make the analysis more useful, we define stagflation as any quarter where there is a combination of accelerating inflation and decelerating growth on a y-o-y basis. In other words, a rise in inflation from 2.0% to 2.1%, for example, would constitute an acceleration in inflation, while a fall to 1.9% would be considered a deceleration and likewise for growth.
However, very benign moves in growth or inflation might not reveal much about how asset classes behave, so we have made a couple of adjustments to account for the severity of phases as well as attempting to capture pre-emptive asset flows.5
Based on our definition, stagflationary periods have occurred more often and lasted longer than one might expect, given the seemingly unsustainable combination of falling incomes amid rising prices. A look at US economic history back to 1971 reveals that stagflation has been the most frequent scenario (occurring in 68 of the 201 quarters) as well as the most enduring, having twice lasted eight consecutive quarters (Chart 3).
The adjustment to a negative supply shock in a stagflationary period has historically been damaging both to the economy and to financial assets, particularly when that adjustment has been large.
Rising price inflation, as income growth is falling, can cause problems in the real economy. Households switch from ‘higher margin’ discretionary spending like holidays, cars and fridges to ‘lower margin’ staples like food and cleaning products. This in turn can lead to a lower net contribution to economic growth as well as the economic stress associated with the rising cost of necessities .
Financial assets are equally impacted, as their future cash flows are discounted at lower growth and higher inflation. ‘Margin compression’ particularly afflicts equities. But a stagflationary environment doesn’t spare bonds either.
How have the major asset classes fared since 1973?
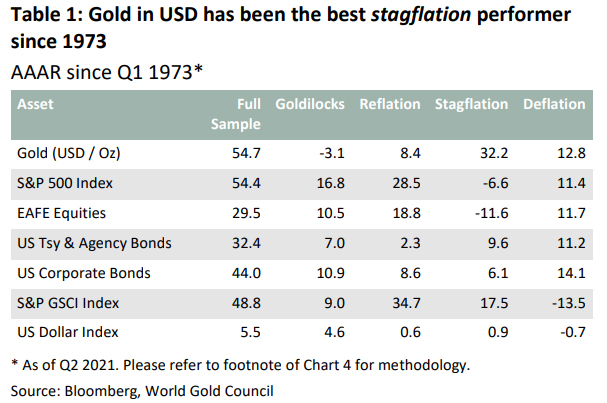
Unsurprisingly, from Q1 1973 to Q2 20216, the top performers during periods of stagflation have been defensive assets and real assets, in particular gold, while equities have suffered the most followed by a mixed performance from fixed income (Chart 4).
Starting with Treasury bonds: they theoretically benefit from a fall in real yields, driven by declining growth. However, the nominal component faces a tug-of-war between the impact of higher inflation (a negative) and a flight to safety (a positive) from elevated risk. The outcome for bonds is therefore somewhat uncertain. The historical evidence reflects this. US Treasuries produced an annualised average adjusted return of 9.6% during stagflations, second only to deflations at 11.2%. The AAAR is the average quarterly return of an asset in a business cycle that has been adjusted by the magnitude of the change in inflation rate and our GDP proxy. This is certainly better than might be expected given that high inflation is generally so damaging to fixed income assets. Without evidence we can only speculate, but it appears the flows from equities to safe-haven assets like bonds and gold are a dominant feature during stagflation (Chart 4 and Table 1).
Corporate bonds have fared relatively worse than Treasuries but not badly, in absolute terms. Credit spreads have tended to widen marginally (4.6bps on average) during stagflation, affected by both flight-to-safety and inflation. Nevertheless, the total return of corporates has been surprisingly resilient.
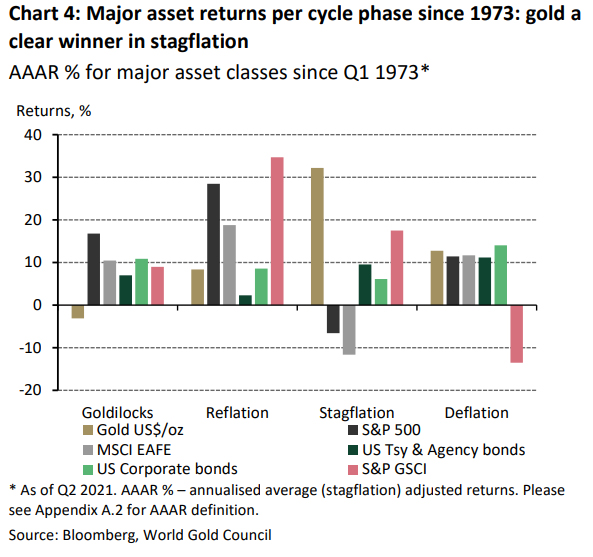
The resilience of fixed income is perhaps a consequence of equities’ poor performance. Stagflationary episodes can be particularly brutal to equity investors, who have historically seen the worst average returns during these phases, squeezed by rising costs and falling revenues. The numbers bear this out, with both the S&P 500 and MSCI EAFE indices (developed markets ex North America) falling an annualised average of 6.6% and 11.6% respectively during periods of stagflation since Q1 1973. However, there are clear variations within equity indices. The shift from discretionary spending to staples spending has benefited the latter: US staples achieved an AAAR of 7.9% compared with declines of 1.3% for consumer discretionary .7
Real assets do well during stagflation, with commodities both fuelling and feeding off inflation, while gold has tended to benefit from the elevated risk environment, rising inflation, and a lowering of real interest rates. Gold’s strong returns come despite a stronger US dollar typically seen during stagflation.
The 1970s probably have an outsized impact on the results from the full period analysis. Since then, we have not experienced similar levels of stagflation. Even considering less extreme incidences, the performance of gold and other asset classes is broadly consistent with what we’ve seen during severe episodes.
How have assets fared over the past 20 years?
Over a 20-year horizon, gold along with global broad bond indices and inflation-linked bonds are the only asset classes to provide positive returns across all four economic scenarios. However, gold’s annualised average weighted returns in US dollar are superior and in many cases more than double that of bonds.
Meanwhile, equities continue to perform poorly, even during these milder episodes. Emerging market equities, small-cap and growth stocks fare the worst, likely a reflection of a stronger US dollar and a faster pace of policy rate hikes typically seen during a stagflation.8
History may rhyme but not repeat
If stagflation appears, analysts’ consensus suggests it could be short-lived. Q4 2021 real GDP is expected to accelerate once more as slowing delta variant infections and pent-up demand support economic growth.9
Yet, prices are expected to remain sticky with the supply logjam unlikely to be resolved any time soon. If the consensus is right, these developments suggest the resumption of a reflationary environment in Q4 2021, where both inflationary pressures and growth are present.
A reflation has tended to be positive for risk assets, with commodities and equities historically being the best performing asset classes. Gold performs well too, with an AAAR of 17.7% during reflationary periods in the last 20 years. On the other hand, a reflationary environment is typically challenging for US Treasuries, which have only seen returns of 0.96% on average over a similar period.
We wondered how likely it is, based on historical data, that a reflation follows a stagflation. Our analysis suggests overwhelmingly that stagflations occur after and before – read ‘during’ – deflations. Of the 68 quarters that we classed as stagflationary, 46% were preceded by deflations and 64% were succeeded by them. Only 21% and 18% respectively were reflations. And only once when a stagflation was preceded by a reflation – as we have experienced today – was it succeeded by one (Q4 1988).
But we caution on projecting purely on the basis of historical evidence. A few things are likely different today and worth noting as the current environment develops:
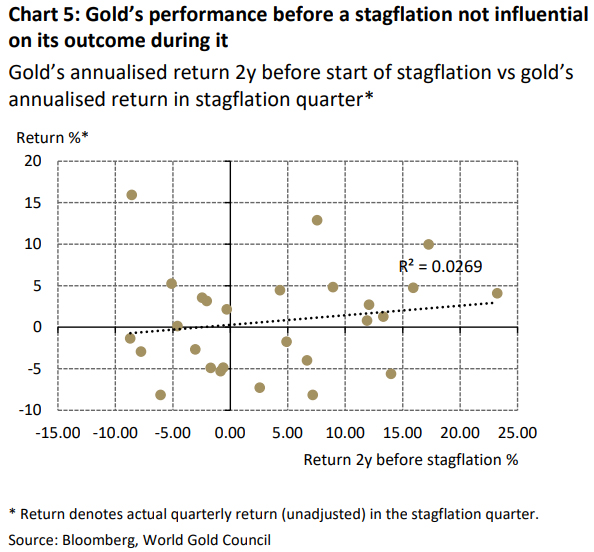
Asset performance prior to stagflation – We highlighted in a blog earlier this year how gold has historically lagged commodities in a reflationary environment. We put much of that down to its generally positive performance prior to a reflation – and how that may cause some demand exhaustion leading into a reflation.
We defined reflations as recoveries from a down-turn, so gold’s safe-haven status has generally benefited its return profile prior to reflations. It is partly this, in our view, that has historically hampered its initial response during reflations as other commodities have soared. So how does this approach look in stagflations? Gold has certainly lagged the commodity complex since the reflation that began after the first COVID-19 lockdown. But over a three-year period, gold’s performance has been strong, having averaged US$1,800 in 2021 – 42% higher than the 2018 average of US$1,269. Could this strength be a headwind even if stagflation materialises? Taking the three-year annualised performance prior to the start of a previous stagflationary period, gold has shown a mixed response with a slight positive bias. In other words, gold’s prior performance hasn’t historically been a problem (Chart 5). But if gold is to be hampered by its performance over the last three years, then the same impact might be seen in other assets, where returns have been equally strong.10
Gold hasn’t benefited from record low real rates in 2021 – Gold’s failure to capitalise on very low real rates has been a concern for investors in 2021. Treasury yields are up more than 50% since January, but inflation expectations have been rising too, keeping real yields in the red. Should low real rates and inflation concerns be a tinderbox for gold? Our answer would normally be yes.
Firstly, this highlights the problem of an overreliance on real rates. Investor sensitivity to nominal yields has been higher in 2021 than in the past, which has mitigated the impact of rising inflation expectations.
Secondly, we believe expectations and sentiment are at play. Consensus remains that high inflation will be transitory. reducing the need for a long-term inflation hedge like gold, for some. The consensus also points to a brief stagflation followed by a return to reflation. That may happen, although the probability appears low. Finally, equity sentiment remains buoyant. Despite recent price weakness, analysts expect 28% S&P 500 earnings growth in Q3 2021 – the third highest since 2010.11
The zero-bound limit and bond-equity correlation - Fixed income’s ability to respond in a downturn has been diminished in a record low yield environment. Investors are already paying to hold bonds in the hope that they will shield portfolios in a crisis (US 2-year TIPS yield has averaged -2.5% in 2021).
The zero-lower-bound isn’t the only obstacle.12 Persistent high inflation could also shift the negative bond-equity correlation that investors have grown used to. Low inflation and an inflation-busting monetary policy have supported bonds as a de facto hedge for over two decades.13 But a higher inflation environment could flip this correlation to positive, which was the norm for a century prior to the late 1990s. If bonds become a less effective hedge, then investors must look to alternative sources of portfolio protection.
Conclusion
Stagflationary environments of falling incomes amid rising prices have shown themselves to be both frequent and durable. When they are severe, they can do damage both to the economy and to financial assets. A return to a more powerful stagflation may bode well for gold based on an analysis of history – where it has been the best performing major asset on data back to Q2 1973. But this analysis is just a guide. A few things are worth noting as we recover from the COVID-19 pandemic.
Gold has already done very well since 2018, in part reflecting many of the underlying and lingering concerns we still have today. A temporary pause doesn’t feel out of kilter even if gold’s drivers are suggesting it should be higher.
In addition, if the market is now expecting a reflation to resurface, after a brief stagflation, then gold might not be the most favoured among the commodity complex. But our analysis suggests the historical likelihood of this is quite low.
Furthermore, we also note that going forward, bonds are unlikely to offer the same protection to a shock to risk assets, constrained by the zero-lower-bound. This offers gold an opportunity to command some of those defensive flows, should a shock to risk assets materialise.
Footnotes
1PMI: Purchasing Manager Index. ZEW: ZEW Germany Expectation of Economic Growth.
2Investopedia definition of ‘stagflation’.
3US business cycle expansion and contraction as defined by the National Bureau of Economic Research.
4Based on the US Consumer Price Index for All Urban Consumers (CPI-U) as provided by the Bureau of Labor Statistics.
5We have restricted the full period analysis to US assets but have included currency impacts on gold returns outside the US. Growth and inflation have become more synchronised globally over the last 40 years, but were less so in the 1970s which would have required individual country analysis.
6Our analysis start date is conditional on data availability. Specifically, our bond indices data starts in Q4 1972. We lose one quarter when calculating returns.
7Returns are based on calculations dating back to 1995 when data on relevant indices was first available.
8Since 1973, the Federal Reserve has hiked policy rates during a stagflation around only one third of the time. However, the magnitude of the change in rates was larger and the average change in policy rates during a stagflation is only -0.9 basis points.
9Bloomberg median consensus Real GDP forecast for the US in Q4 2021 is 5.8% vs 5.6% in Q3 2021.
10S&P 500 has gained an annualised 24%; MSCI EM: 15.2%; US Treasuries: 4.9%; US corporates: +9%.
11Facset Earnings Insight, 24/09/2021.
12The zero-lower-bound is a theoretical limit for bond yields, one that exists because investors have the option of holding cash instead of a negative yielding asset.
13PIMCO: The role of bonds in a new era of low yields; AQR: 2021 Capital Market Assumptions for Major Asset Classes.
![]() Our free weekly precious metals email brings you weekly news of interest to precious metals investors, plus a comprehensive list of gold and silver buy and sell prices.
Our free weekly precious metals email brings you weekly news of interest to precious metals investors, plus a comprehensive list of gold and silver buy and sell prices.
To subscribe, log in or Register, and sign up in your Account page. It's free.
Comparative pricing
You can find our independent comparative pricing for bullion, coins, and used 'scrap' in both US dollars and New Zealand dollars which are updated on a daily basis here »
Precious metals
Select chart tabs
6 Comments
I don't think US alone can suppress rising gold prices.
History might repeat itself.
So will all the neolibs expect to get bailed out again? Not bloody likely. Hope the whole stinking corrupt mess falls like it deserves to.
by
Audaxes
|
16th Oct 21, 5:25pm
I would suggest we going to see high stagflation. And you need real gold not useless paper gold. This is really going to be ugly. We have people who don't want or know what work is, and to keep them from governments back is to print more money.
Some historical context: 1970s stagflation was caused by two massive oil shocks that tripled the price of oil. Keep your hair on grandma.
It'll just be transitory stagflation.
We welcome your comments below. If you are not already registered, please register to comment
Remember we welcome robust, respectful and insightful debate. We don't welcome abusive or defamatory comments and will de-register those repeatedly making such comments. Our current comment policy is here.