

The 'longer is stronger' move in the mortgage market exploded in December and then continued strongly in January, latest Reserve Bank figures show.
As we've highlighted before, 'short is good' very much became the mantra for NZ home owners with a mortgage from the start of 2024 as they anticipated - correctly - that the RBNZ would start to reduce the Official Cash rate from the then cycle-high of 5.5%.
The RBNZ started reducing the OCR in August 2024 and continued right through to November 2025, with the OCR now standing at 2.25%.
Through this period, generally popular options such as two-year fixed rate mortgages were abandoned in favour of shorter and shorter terms - and then even floating rates came to prominence.
But after the November 26 OCR decision and clear indications from the RBNZ that barring unforeseen circumstances there would be no more cuts - and therefore by extension the next move would be up - the mood changed quickly. Suddenly it was 'longer is stronger'.
The RBNZ notes in its summary of the January mortgage data that housing lending due to reprice in over one year now accounts for 30% ($116 billion) of all housing lending, surpassing the 30% mark for the first time since February 2024. (I should though say at this point that the RBNZ's calculations don't include the nearly $6 billion of business lending that is secured by a residential property, whereas the figures I'll be using further down this article DO include that $6 billion).
The swift changes in lending duration are highlighted by these great charts the RBNZ produces, with the latest seen below:
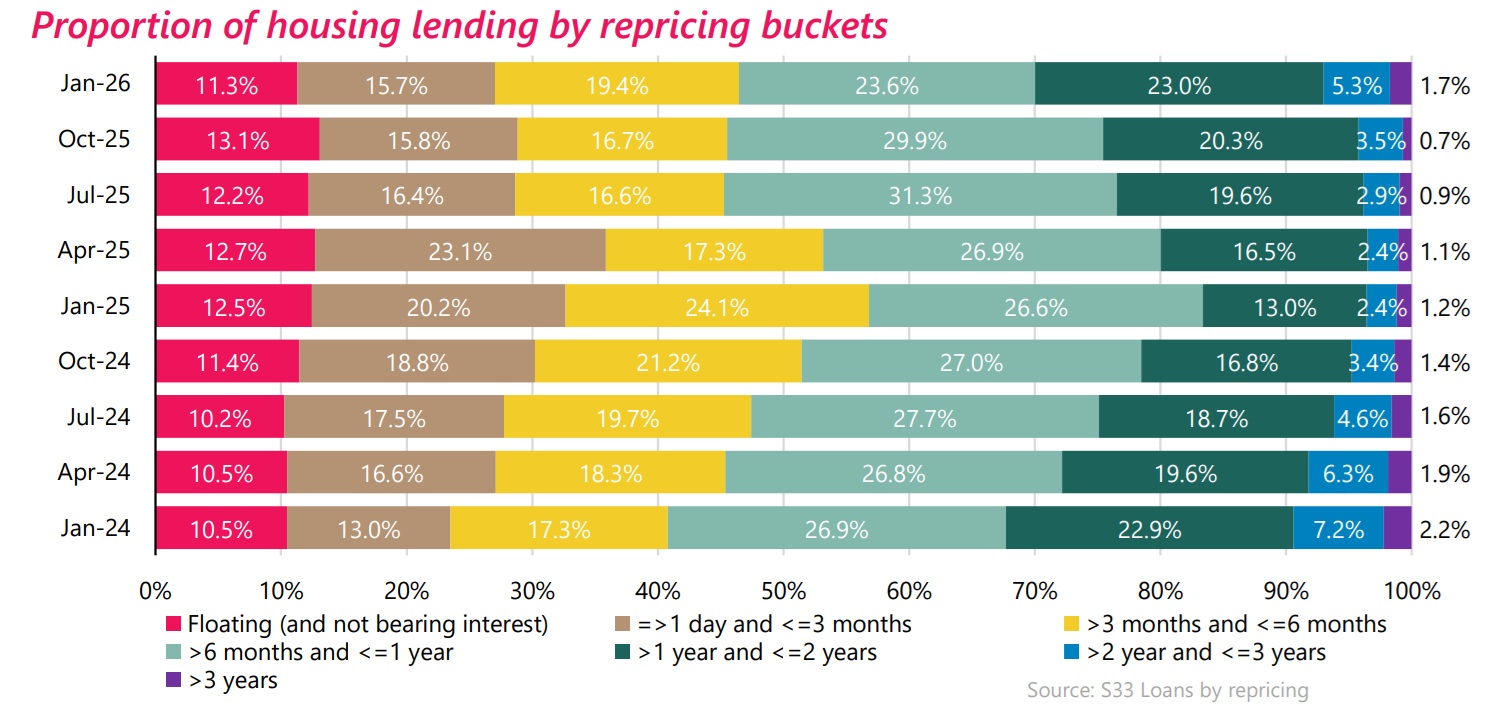
The 30% figure the RBNZ refers to can be seen at far right of the January 2026 line, starting from the dark green bit.
And we can see looking back at January of last year, just how 'short' the lending became, with 56.8% of the total mortgage book either floating or on fixed durations of no more than six months. The comparative figure as of January 2026 is now just 46.4% of the book either floating or with fixed durations of no more than six months. And that move represents billions and billions of dollars.
The total outstanding mortgage stock held by banks as of January was $393.086 billion.
For me perhaps the most interesting aspect of the latest figures is the movement of mortgage money in durations in excess of two years.
Longer term mortgages did have their moment in the sun during the 2021-22 period when the RBNZ was starting to crank up the OCR.
A big shift to fixing for over two years
In March 2021 you could get a five-year term for 3.0%. Yes, you really could. Some people (though relatively few) did have a nibble. And so those people will be looking at refixing now having presumably cruised through the last five years!
About $10 billion worth of mortgages was on five-year terms as of the end of 2021, but the figure has gradually dwindled to virtually nothing - until very recently.
In November the figure of mortgages with five years to run was at just $1.262 billion. However, just two months later this had nearly quadrupled to $4.58 billion.
And if we look at the total of mortgages on terms in excess of two years, (so, three years and more) this figure has risen by more than $10.5 billion from $16.882 billion to $27.578 billion - a 63.4% increase.
Is this the shape of things to come?
Well it will be interesting to see won't it? Generally Kiwi homeowners don't want to countenance the idea that they might get left paying more than they have to later on because they've fixed for so long and interest rates have then dropped below what they are paying. But, of course, anybody who manages to pick now where interest rates will be in five years will have done so by accident! Because nobody's that good! In a global sense at the moment, the only certainty appears to be uncertainty.
But back on those mortgages, another interesting aspect of the January figures was another quiet step up in the activity of the investors.
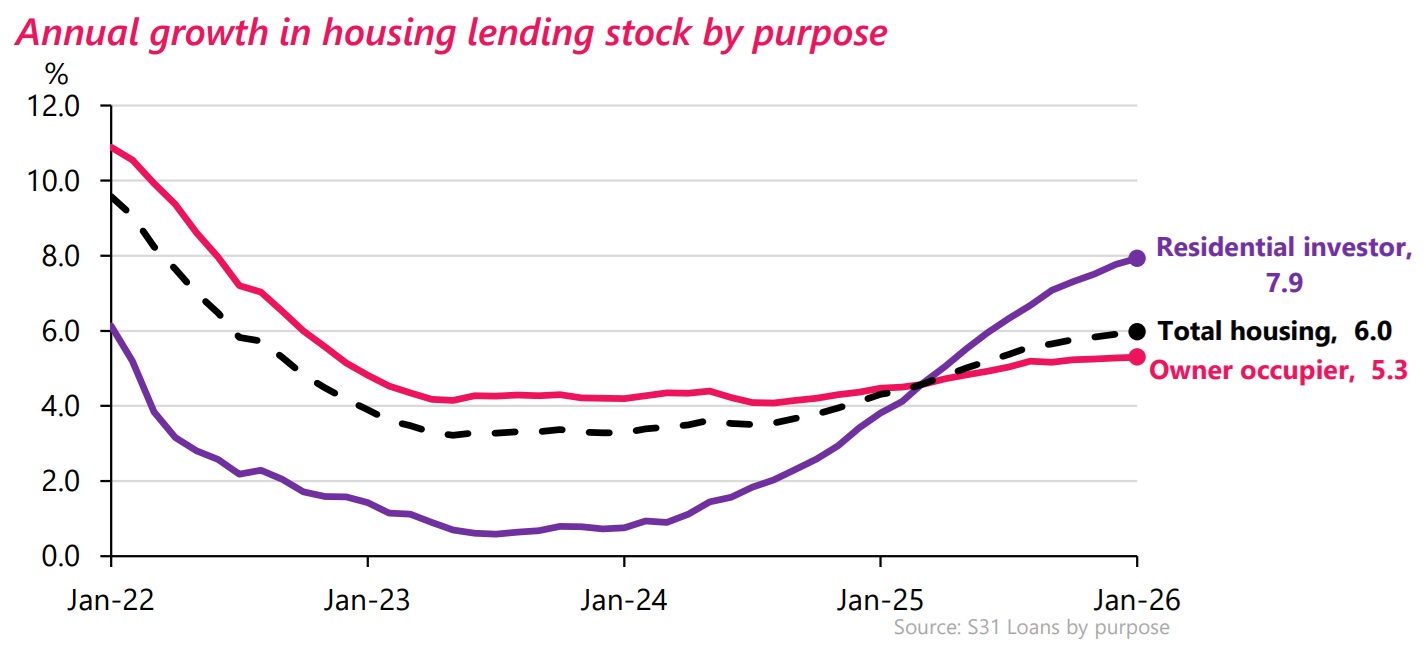
Having passed the $100 billion worth of outstanding mortgage stock mark in December, the investors added a further $567 million in January, pushing the pile up to $101.303 billion.
In the past 12 months then the investors have added $7.444 billion to their outstanding mortgage stock figure. Between January 2024 and January 2025 the investors grew their mortgage pile by only a little under $3.5 billion.
And, interestingly, during the 'going gangbusters' market pandemic market frenzy the investors added $8.096 billion between January 2020 and January 2021 and $6.646 billion between January 2021 and January 2022.
So, the current level of activity is not much below those manic days - and remember, prices were higher then, at least in the latter part of the period.
FHBs gearing up
The first home buyers (FHBs) stayed strong in the market right through the post pandemic downturn and they are still in there and getting their share.
But they are gearing themselves up...
We've already reported on the high level of low equity loans going to the FHBs in January.
The RBNZ also notes that increasing numbers of FHBs are borrowing at higher debt-to-earnings ratios as well, something which is not necessarily unexpected if they are borrowing a lot - as evidenced by large numbers of low equity loans. But it is another level of concern.
The RBNZ said of the $1.064 billion of total new lending to FHBs in January, 22.6% had both a DTI more than five times their incomes and a loan to value ratio of over 80%, up from 17.2 per cent in December 2025.
"This is the highest level since November 2021, when the share also stood at 22.6%," the RBNZ said.
Well, the job market is showing signs of picking up. Here's hoping it continues to do so.
*This article was first published in our email for paying subscribers. See here for more details and how to subscribe.
1 Comments
The RBNZ needs to stick to its knitting, instead of constantly spouting spin and trying to pump life into the NZ ponzi housing market. Making statements like; "infation will fall to 2%," and "the job market is showing signs of picking up", without any evidence, undermines what credibility they have left.
There could not be a worse investment decision than buying real estate in NZ.
We welcome your comments below. If you are not already registered, please register to comment
Remember we welcome robust, respectful and insightful debate. We don't welcome abusive or defamatory comments and will de-register those repeatedly making such comments. Our current comment policy is here.