
The recent tax revelations about who is paying what in conjunction with government spending has suddenly gained greater importance to many. Especially with both the budget and election looming closer. Starting with government spending as a percentage of GDP the Labour-led government since 2017 has certainly lived up to the criticism that it hasn’t controlled spending well.
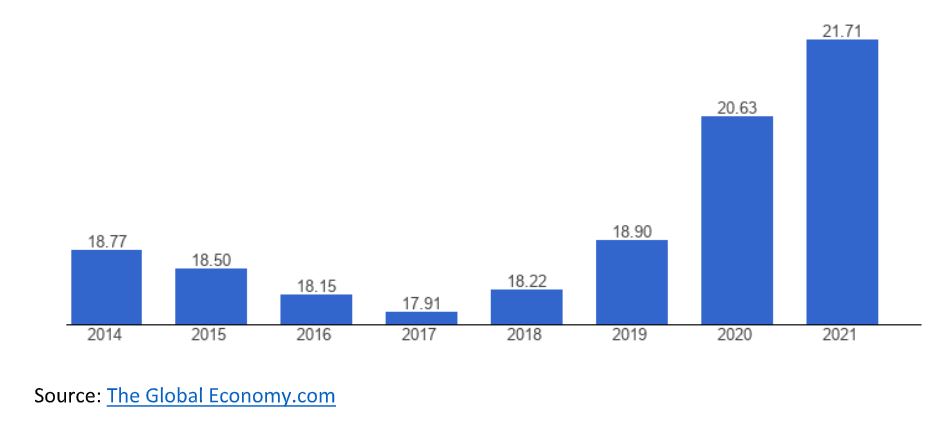
It conversely could argue that the previous National-led government's lack of spending has led to the situation meaning they had to catch up with an overabundance of run-down infrastructure. And of course since 2020 there is the pandemic influence. In 2020 spending is likely to
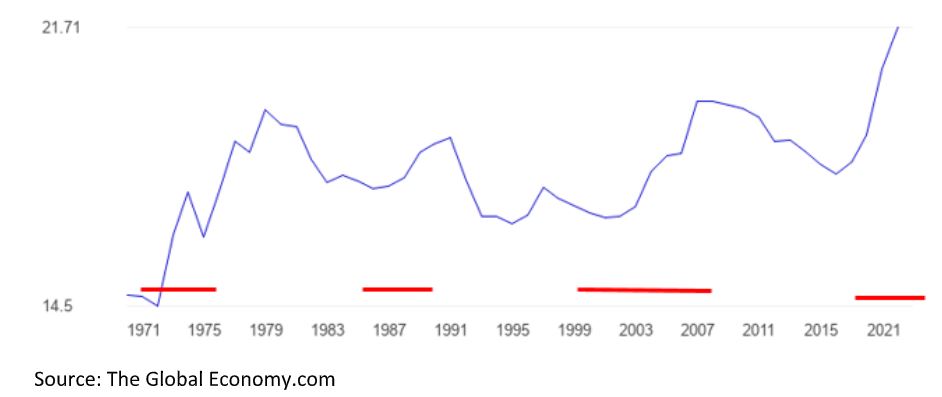
have gone up with government support packages while the GDP fell away making the gap widen. A longer-term graph however does show a similar trend as can be seen below with Labour’s periods of government matching the red lines.
Going to a different source, the OECD it showed that in 2020 New Zealand’s general expenditure was slightly (+10%) ahead of the OECD average. The caveat is that comparing different countries' economic performances is potentially fraught with inaccuracies due to different reporting and
measuring techniques. And as shown above can vary considerably from year to year.
Another measure commonly used analyse governments frugality or otherwise is the number of public servants per capita. According to the OECD, in 2020, New Zealand had 51.6 public servants per 1,000 people, which is lower than the OECD average of 63.3 public servants per 1,000 people.
This, despite the high increase in spending, likely shows the influence the pandemic had on the government books. Reinforcing the numbers of civil servants is the measure of the percentage of the workforce employed in the public sector. According to the World Bank, in 2020, New Zealand had
15.9% of its workforce employed in the public sector, which is lower than the OECD average of 21.2%. A country with a similar population to New Zealand (although totally different geographically) and one that many would like to emulate with its seemingly successful health and education sectors among others is Finland. Population 5.54 (2021) versus New Zealand 5.12
According to the OECD, in 2020, Finland had 62.2 public servants per 1,000 people, which is slightly higher than the OECD average of 63.3 public servants per 1,000 people and considerably more than New Zealand’s. Likewise, the percentage of the workforce employed in the public sector.
According to the World Bank, in 2020, Finland had 22.7% of its workforce employed in the public sector, which is higher than the OECD average of 21.2%. Again approx. 30% more than New Zealand. This bigger public sector which in Finland’s case seems to bring social benefits comes at a cost.
In 2020, the total tax paid per capita in Finland was US$15,668, according to data from the Organisation for Economic Co-operation and Development (OECD). Compared to other OECD countries, Finland's total tax paid per capita is higher than the OECD average of US$10,522. In 2020, the total tax paid per capita in New Zealand was US$9,054, according to OECD data. So, a 50% increase over New Zealand, however for the same period, according to the World Bank, the gross national income per capita in Finland was US$51,340 in 2020.
In contrast, the gross national income per capita in New Zealand was US$40,290 in the same year. So, (only) a 25% reduced income in New Zealand also relating to Finland’s higher tax rate, it does have a capital gains tax, 30% up to €30,000 then 34%, which given the recent media conversations may account for some of the difference.
Closer to home, as of 2021, New Zealand's tax revenue per capita was lower than Australia's tax revenue per capita. Again from the OECD, New Zealand's tax revenue per capita was US$16,791, while Australia's tax revenue per capita was US$21,292. The different numbers to above show the variability that comes from using different sources but the comparisons are still valid.
Overall, it's difficult to make a definitive comparison between the two countries' tax systems based solely on tax revenue per capita. Other factors, such as the types of taxes collected, (Paye, GST, capital gains etc) the effectiveness of tax collection, and the impact of tax policies on individuals and businesses, also play important roles in determining the overall tax burden in each country. As of 2021, the average income in Australia is generally higher than in New Zealand. Data from the OECD, showed the average household disposable income per capita in Australia was US$36,245, while in New Zealand it was US$29,166.
So, tax and income differences are fairly well aligned. Perhaps surprising to many Kiwi’s using OECD numbers, the total tax burden in New Zealand for an average income earner including all taxes on goods, services, and income, is below the OECD average. In 2020, the average tax wedge, which is the difference between the total cost to the employer of hiring a worker and the worker's take-home pay, expressed as a percentage of the total cost, for a single person earning the average wage in New Zealand was 18.4%. This compares to the OECD average of 35.9%. When it comes to how ‘hungry’ the government is for tax income as a percentage of GDP, New Zealand fades into the background compared some others at 31.6% (OECD 2019 figures).
1. France - 45.4%
2. Denmark - 43.2%
3. Belgium - 41.8%
4. Sweden - 41.6%
5. Finland - 41.3%
Our top marginal rate of 39% for over $180,000 compares to 45% for Australia (also $180,000) with some like Belgium up to 50%.
When it comes to agriculture, this is a “rural” section after all, and the number of regulations inflicted upon the sector, farmers will not be surprised to know that New Zealand has more regulations around agriculture than the average for OECD countries. On the OECD's Product Market Regulation (PMR) database, New Zealand ranks above the OECD average for the stringency of its agricultural regulations.
The PMR database measures the stringency of regulations across a range of industries, with higher scores indicating more stringent regulation. In the latest PMR data available (as of 2018), New Zealand's score for agricultural regulation was 0.37, compared to the OECD average score of 0.28. (The scale goes from 0-6 with 0 indicating few regulatory barriers to operations and 6 no doubt throttling). The USA and the EU are 0.21 on the same scale. While this doesn’t necessarily indicate New Zealand is far more regulated than others, as the PMR can have different foci in different countries, it does show that New Zealand is certainly up there in the more highly regulated zones.
Comments have been made that the increase in regulations may be in part due to New Zealand’s deregulated economy post 1980’s leading to less than desirable practices, which now are having to be regulated to get into a ‘catch-up’ phase, (perhaps).
When it comes to the different government performances in the sector, under National-led governments, agricultural regulations tended to prioritize economic growth and productivity, while under the current Labour government, there has been a greater focus on environmental sustainability and social responsibility. Although it was National that brought in the Resource Management Act in 1991, which was considered world leading at the time. (Although the RMA's political father was former Labour Prime Minister Geoffrey Palmer).
So, what the data does show, be it taxation, spending or regulating the major parties do seem to have some fundamental differences. I guess that is why we have elections.
We welcome your comments below. If you are not already registered, please register to comment
Remember we welcome robust, respectful and insightful debate. We don't welcome abusive or defamatory comments and will de-register those repeatedly making such comments. Our current comment policy is here.