

The New Year has seen steady demand and price for domestic logs and increased demand and price for export logs, especially pruned logs.
The price differential between pruned and unpruned logs has widened in the past few months.
In some areas such as Gisborne, the differential between pruned and A-grade logs is up to $64/tonne.
At this differential, pruning starts to look like an economic operation again and the differential could well increase even further.
Export Log Market
Since December last year, CFR price (the US$ price of logs landed at the destination port) rose a little and has stayed steady at around US$127-131 for A-grade.
Falling ocean freight rates (see below) and a lower NZ$/US$ cross rate has supported increasing NZ$ at-wharf-gate prices.
Pruned logs have been in particularly strong demand with stronger price increases than unpruned logs.
Since the end of last year, total log stocks in China have increased marginally from 3.09m m3 at the end of last year to 3.16m m3 at as the 31 January 2015.
This stock level is still well down on the peak of 4.4m m3 in July of last year.
Average sales have dropped to just over 41,000 m3 per day, meaning stocks represent about 2.4 months of sales. Supply from USA and Canada is down markedly on the peaks of last year, but supply from New Zealand is strong and volumes are up markedly from Australia and Russia.
Russian is experiencing significant increases in domestic returns due to its very weak currency which is stimulating supply.
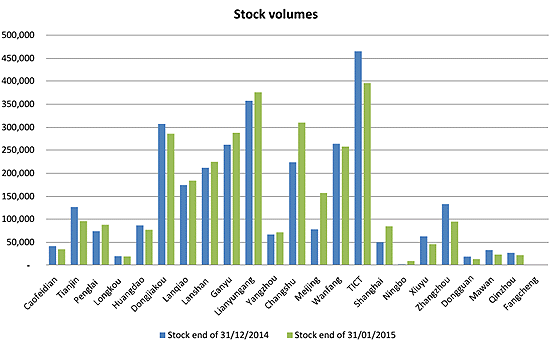
Log stocks at the main sea ports across China rose slightly in January 2015 to 3.16m m3 but are still well off the peak of 4.4m m3 in July of last year.
China is settling into a new mode of more modest growth whilst the government works on trying to restrain the housing market whilst pushing ahead with structural reforms and its anti-corruption drive.
For calendar 2014, Westpac reports real Chinese GDP expanded at 7.4% versus 7.7% for both 2012 and 2013. Its outlook for 2015 is just “a little shy of the 2014 outcome”.
House prices in China remain under pressure with developers continuing to discount aggressively in the new-house market and prices continuing to fall. The coastal tier-one cities are seeing some strength in the secondary market (houses being on-sold by owners) as bargain hunters emerge – December 2014 saw price increases in this segment in Beijing, Shanghai, Shenzen and Guangzhou.
Overall, however, 90% of the 70 cities monitored continued to show price declines.
Despite this, the market is considered to have troughed in this cycle. The price falls are having the required effect of subduing new housing starts and should boost confidence as surplus stock is cleared (see chart below).
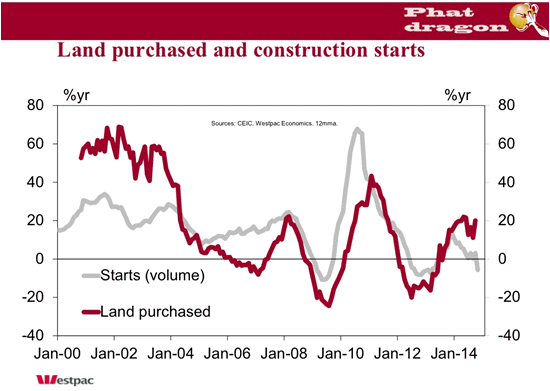
Source: Westpac’s Phat Dragon Report. Housing starts in China have been in a declining trend for nearly a year and dipped into negative territory at the end of last year. This typically is closely followed by a cyclical upswing in activity.
The Indian market became overstocked from excess log supply late last year and most exporters have been diverting planned Indian sales to China so far this year.
This increase in volume to China and the anticipation of the Chinese Lunar New Year and Spring Holiday is putting downward sentiment on log price.
It is widely expected that CFR will fall below US$127 for A-grade logs. This holiday event is officially from 19-24 February but most expect business to be substantially disrupted for a two full weeks.
Ocean freight rates have continued to fall. As reported in December 2014, bunker prices (the fuel by merchant vessels) have fallen significantly in the past six months (see chart below). As a consequence ships are being operated at faster speeds since fuel has become a lower proportion of total costs. The faster speeds can increase charter yields through higher ship utilisation.
However, in aggregate, this response, along with relatively soft ocean freight demand, has resulted in a dramatic fall in charter rates due to the increased supply of freight-tonne capacity.
The Baltic Exchange Handysize Index as published by Affinity Shipping has plummeted from 482 at the start of January 2015 to 301 as at the 5th or February 2015, a drop of 37%! This, combined with the continued low bunker prices is resulting is very low ocean freight rates for logs; some reported in the low US$20s for 1:2 or 2:1 load:discharge schedules.
We will have to wait and see whether the small kick up in bunker price in the past week or two as shown on the chart below is the start of an upward trend.
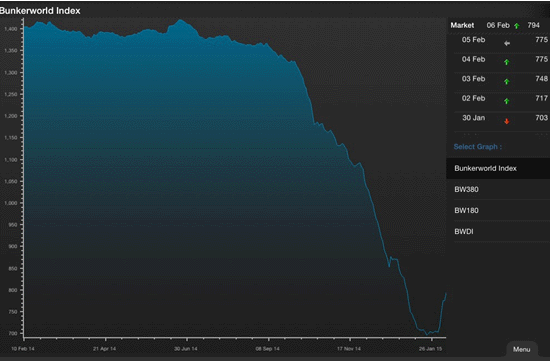
Source bunkerworld.com. Bunker prices have plummeted in the past 6 months and driven ocean freight rates lower. This has in-turn had a softening effect on ship charter rates as faster ship operating speeds increase the supply of freight-tonne capacity.
As reported in December 2014, increased investment in pruned log processing in China is driving increased demand and price in New Zealand.
Unlike domestic pruned log sales where the purchaser can give timely feedback about pruned log quality, it can be months after supply that pruned logs are processed in China. The delayed feedback result in risk for the purchaser and value is lost in averaging down the price.
This has made it difficult for a premium to be established for quality export pruned logs.
To address this, PF Olsen has launched a project of estimating pruned log quality by sampling cross sections of the pruned log prior to sale. This is one of few ways to estimate pruned log quality in the absence of detailed and reliable records of past pruning operations. Logs with high pruned log quality (pruned log index) are then able to attract a premium thereby rewarding forest owners who have invested and succeeded in producing this sought after product.
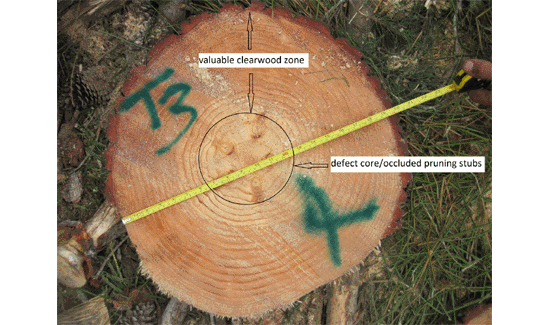
To achieve a premium for quality pruned logs PF Olsen is assessing pruned quality by sampling cut cross sections of pruned logs and deriving a pruned log index (PLI). Pruned logs like this one with a high PLI attract premium pricing.
Domestic Log Market
Domestic log prices commenced the year almost unchanged from the end of last year. There were modest increases in pruned log price where supply was tight as many domestic pruned processors are benefiting from strong demand for clearwood from the USA and a depreciating Kiwi dollar.
Demand for structural logs remains steady but most mills are getting sufficient supply putting no particular direction to price.
In January New Zealand was deemed one of the least affordable places to own a home according to an international housing affordability survey. The report described Auckland, Christchurch, Tauranga-Western Bay of Plenty, Wellington and Dunedin as “severely unaffordable”. Auckland is New Zealand’s least affordable market with a median house price 8 times the median income (up from 6.7 last year). Along with a raging mortgage war amongst banks and the Christchurch rebuild, we expect to see strong new building activity and demand for wood products for the next few years. Hopefully New Zealand can get to a position where new housing stock catches up with demand and prices ease to allow first home buyers to get into the market.
While investment is domestic wood processing has been modest in the past few years, the announcement last year by Rotorua-based Red Stag of constructing a state-of-the-art super mill to see log input double to 1.2+ m m3 per annum was significant.
This and other changes and investments in domestic processing are detailed well in a Scion on-line article titled "New investment in wood processing spotlights future log supply".
Australia’s non-residential construction sector (comprising about 70% of total construction activity) is softening on the back of the downturn in the mining sector in response to weak commodity prices.
In contrast, the residential sector overall is strong with dwelling approvals for 2014 10% higher than the prior year. Just under one-third of Australia’s lumber imports come from New Zealand, and just under one-half from the EU.
New Zealand is also Australia’s largest single supplier of wooden mouldings, supplying just over 34% of all imports in 2014.
The PF Olsen log price index rose from $104 in December 2014 to $108 this month. It is now $23 higher than its cyclical low of $85 in November 2011 and $21 above the last low of $87 in July of 2014. The index is still $9 below the March 2014 peak of $117 but $6 higher than the four year average of $102.
PF Olsen Log Price Index
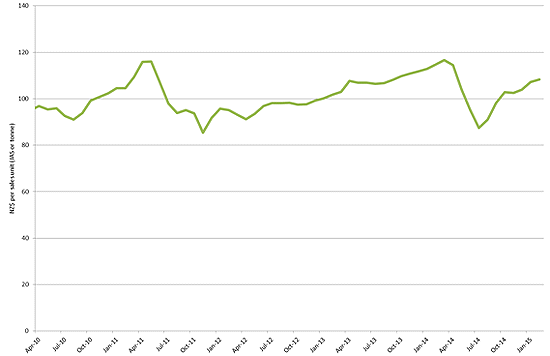
Basis of Index: This Index is based on prices in the table below weighted in proportions that represent a broad average of log grades produced from a typical pruned forest with an approximate mix of 40% domestic and 60% export supply.
Indicative Average Current Log Prices
| Log Grade | $/tonne at mill | $/JAS m3 at wharf |
| Pruned (P40) | 150 | 164 |
| Structural (S30) | 112 | |
| Structural (S20) | 97 | |
| Export A | 116 | |
| Export K | 106 | |
| Export KI | 100 | |
| Pulp | 50 |
Note: Actual prices will vary according to regional supply/demand balances, varying cost structures and grade variation. These prices should be used as a guide only and specific advice sought for individual forests.
---------------------------------------------------------------
This article is reproduced from PF Olsen's Wood Matters, with permission.
We welcome your comments below. If you are not already registered, please register to comment
Remember we welcome robust, respectful and insightful debate. We don't welcome abusive or defamatory comments and will de-register those repeatedly making such comments. Our current comment policy is here.