


Log prices paid by mills were generally unchanged with the occasional price increase for unpruned logs. Prices received for export logs delivered in October dropped on average $1-$2/JASm3 from September prices for non-pruned and $3-4/JASm3 for pruned logs.
There has been a significant and relatively unforeseen increase in ocean freight rates. This increase has averaged about US$7/JASm3 and has been partially offset by the weakening of the NZD against the USD. Freight rates are expected to level out in November.
China log demand remains steady with occasional small price increases, and October is traditionally the highest price point in the second half of the year for logs in China. The Korean log market is once again steady, and the Indian log markets shows signs of recovery.
Due to the decrease in export prices the PF Olsen Log Price Index for October has reduced to $124. The average sale price is currently $10 per tonne above the three-year average.
Domestic Log Market
Demand
The domestic mills report very little change in domestic demand other than the usual variations due to weather. There have been a few slight changes in some export lumber markets, but these were well anticipated and had no effect on the local mills.
The domestic mills have also experienced an increase in the ocean freight costs, but have benefitted by the weakening NZD. Approximately 14% of NZ lumber exports (by value) are to Australia, and the weakening of the NZD by a couple of cents since mid-August has increased returns. These exporters however, do have to contend with one of the most expensive ocean freight costs across the Tasman Sea, ranging from $70-$100NZ/m3.
Log supply
Log supply continues to be balanced around most of the country. There are some regional shortages as has been reported in the media about Northland. The mills in Canterbury are also concerned about supply going forward. This has been exacerbated by the windthrow of 2013 which removed some 1.5M tonnes of standing timber and its effect on wood-flow is being noticed sooner than thought.
Export Log Market
China
The market remains well balanced between supply and demand. The stock levels across China continue to hover around 3.3M m3, and rose only slightly during China’s “Golden Week” holiday in the first week of October. The demand is still very strong across all log grades, with a healthy daily offtake of 65K m3/day. One interesting point about the current inventory in China is that the percentage of radiata pine logs has decreased while the percentage of North American logs has increased. This is even though the supply of North American logs dropped 18% in August. This shows New Zealand logs have been more saleable than the more expensive North American logs.
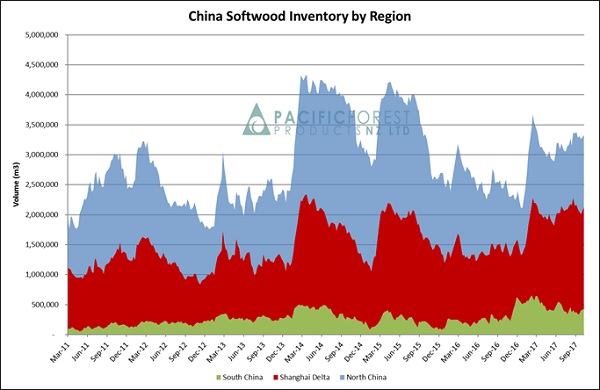
Courtesy: Pacific Forest Products (PFP)
India
The Indian market has remained dull and flat for the last three months with prices hovering around US$150/JASm3 for A Grade longs, and shipping rates touching US$38 to $40/JASm3 making exports to India almost unviable. The key factor for the flat market behaviour has been liquidity issues stemming out of GST upfront payment to the Indian Tax Department at the time of releasing cargo from port.
September was a slow shipment month from NZ to India with just three vessels heading to India. This caused some relief in the Kandla market, and sawn timber prices have become marginally bullish in the first half of October as log stocks have depleted. However, there will be virtually no change in the market in October, as the festival of Diwali implies working holidays and mill closures until 30 Oct 2017. The CEO for Aubade NZ (a large exporter of New Zealand logs to India) Satinder Singh expects November/December to be the turnaround period and feels a strong sentiment emerging for demand to increase as cash cycles affected by GST filing are expected to have normalised. Aubade NZ forecast the Indian log market is set to accommodate on average 5-6 vessels per month from NZ for 2018.
This augers well for log prices and supply in the period of Nov 2017–Feb 2018. This would be very welcome news as February 16, 2018 is the Chinese New Year. The Indian market could provide a good balance to keep demand reasonable.
Korea
The Korean log market is a very mature log market with no significant changes forecast. The current geo-political climate with North Korea seems to have little effect on log demand, and any demand fluctuation is mainly market driven. Kwang Won Lumber Co Ltd which is the second largest buyer of logs in Incheon, Korea, stopped buying logs in July, and logs destined for this mill were diverted to other mills and overall demand was diminished. This mill re-commenced buying in September under court control. Due to this situation log sales to Korea in Aug 2017 were 8% down on the same month in 2016, but log sales are still 8% up on an annualised basis.
Ocean Freight
The ocean freight price to ship logs from New Zealand to China has increased by an average of $7/m3 USD across the country. While I did report last month that “industry commentators now suggest indications are for increasing freight rates in Q4”, these increases are more than expected. The two main factors driving this recent increase in freight costs are detailed below. Most market commentators expect this to be short term and not have lasting effect on ocean-freight rates:
-
There have been significant vessel delays due to monsoon and other weather events around Asia. The port of Chittagong in Bangladesh, for example, at one point had 150 ships waiting for a berth. While this port often struggles with increasing demand, that is a lot of ships! This means there is a reduction in the available shipping capacity.
-
There has been a surge in freight demand due to iron ore and coal being imported to China before new stringent environmental regulations come into effect. In last month’s Wood Matters PF Olsen indicated how the tightening environmental regulations may affect local saw millers and here we see another consequence of this for the NZ forest industry. While iron ore and coal tend to be shipped in the larger Capesize and Panamax vessels, the demand cascades down the dry bulk carrier fleet. Material that was shipped in Panamax carriers starts getting shipped in Supramax and Handymax vessels, and so on. The Wood Matters edition of March this year has an explanation of the freight scene for further reference.
The Bunker World Index (BWI)
The price for fuel bunker has trended upwards since mid-June of this year.
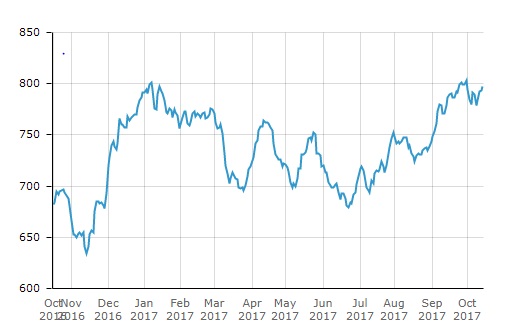
BWI graph courtesy of S&P Global Platts.
Foreign Exchange
The exchange rate continues to have a significant impact on AWG prices for logs. The NZD relative to the USD has continued to drop from the high of 0.7503 in July to 0.7179 in mid- October. This reduction in the NZD has countered the effect of rising freight costs on the ‘At Wharf Gate’ prices received for logs in New Zealand.
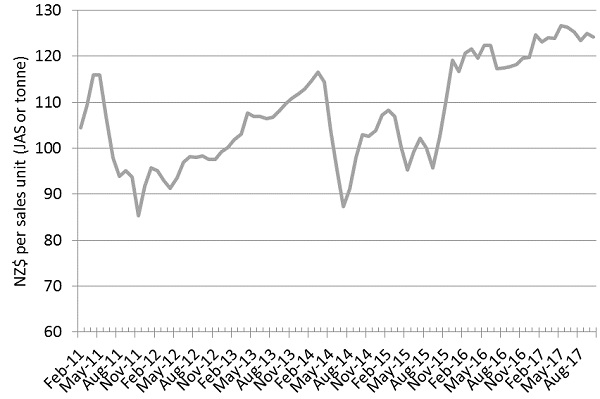
PF Olsen Log Price Index to October 2017
The PF Olsen Log Price Index for October decreased one dollar from the September index figure and is now at $124.The index is currently $3 higher than the two-year average, $10 above the three-year average and $14 higher than the five-year average.
Basis of Index: This Index is based on prices in the table below weighted in proportions that represent a broad average of log grades produced from a typical pruned forest with an approximate mix of 40% domestic and 60% export supply.
Indicative Average Current Log Prices – October 2017
| Log Grade | $/tonne at mill | $/JAS m3 at wharf | ||||||||
| Oct-17 | Sep-17 | Aug-17 | Jul-17 | Jun-17 | Oct-17 | Sep-17 | Aug-17 | Jul-17 | Jun-17 | |
| Pruned (P40) | 182 | 182 | 183 | 183 | 188 | 179 | 179 | 175 | 175 | 180 |
| Structural (S30) | 120 | 120 | 120 | 118 | 112 | |||||
| Structural (S20) | 109 | 108 | 108 | 107 | 104 | |||||
| Export A | 137 | 138 | 134 | 139 | 141 | |||||
| Export K | 131 | 132 | 127 | 131 | 133 | |||||
| Export KI | 122 | 123 | 119 | 122 | 125 | |||||
| Pulp | 47 | 47 | 47 | 47 | 50 | |||||
Note: Actual prices will vary according to regional supply/demand balances, varying cost structures and grade variation. These prices should be used as a guide only..
This article is reproduced from PF Olsen's Wood Matters, with permission.
We welcome your comments below. If you are not already registered, please register to comment
Remember we welcome robust, respectful and insightful debate. We don't welcome abusive or defamatory comments and will de-register those repeatedly making such comments. Our current comment policy is here.