
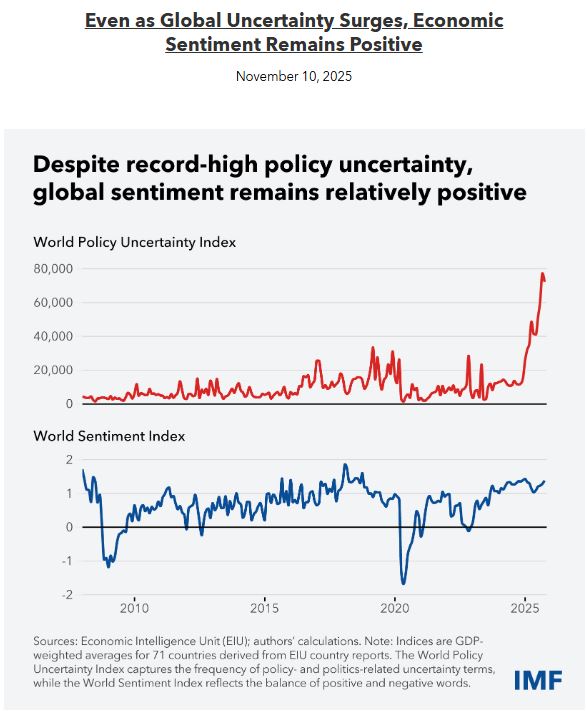
Our blog’s Chart of the Week series tracked how the global economy evolved in 2025, with the top five charts highlighting some of the key issues shaping economic and policy discussions.
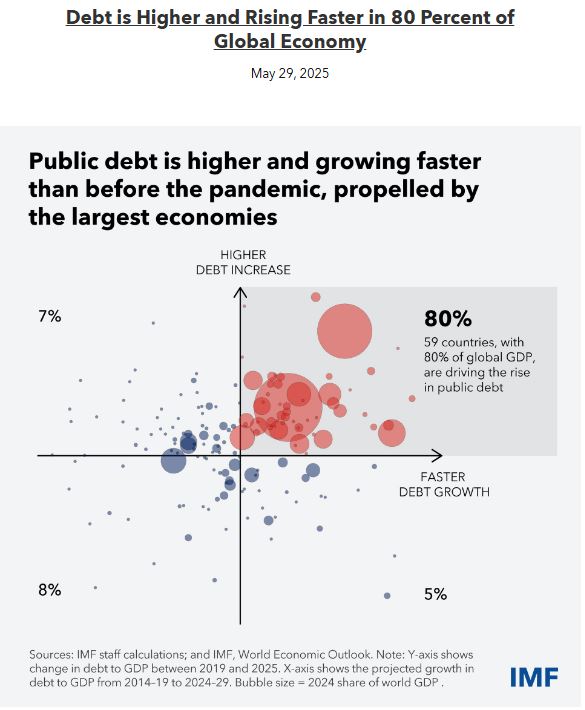
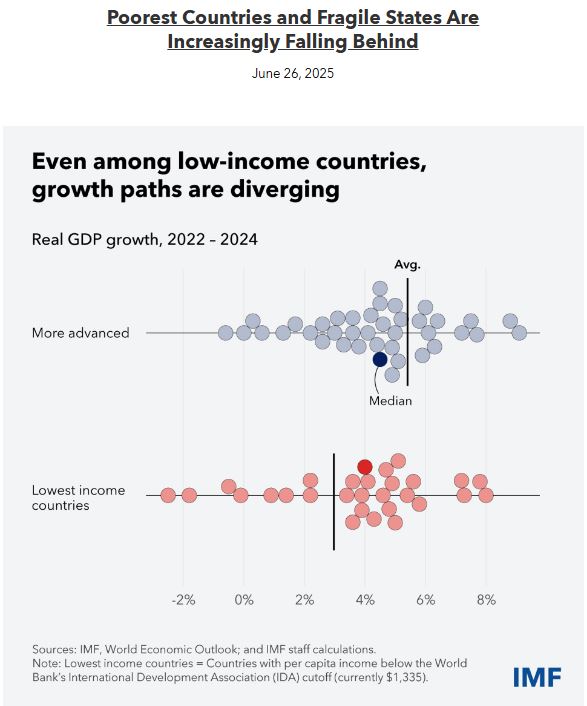
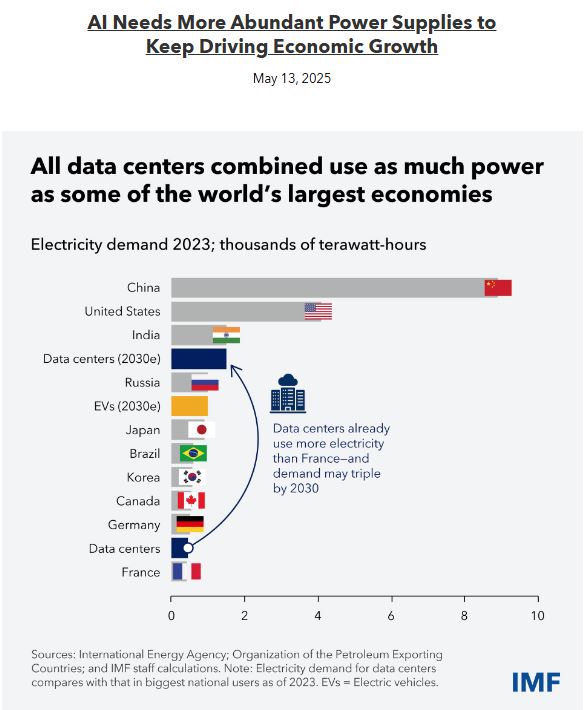
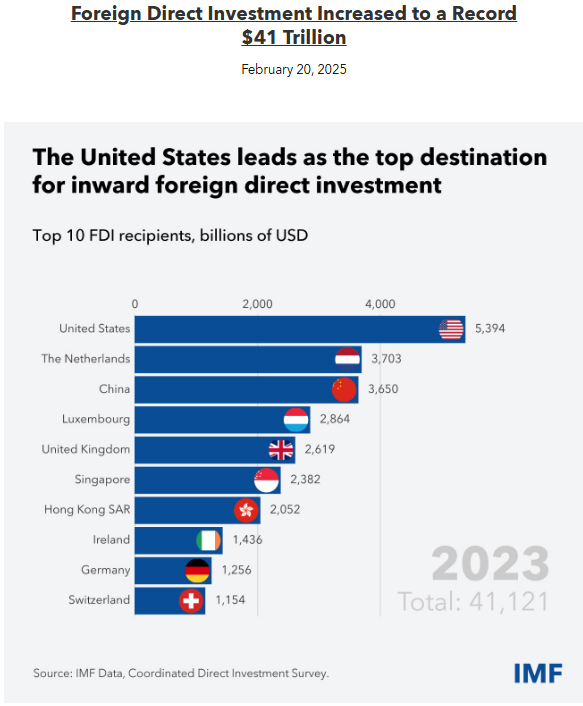
They show economic sentiment enduring despite elevated uncertainty, even as public debt climbed at a faster pace across many of the world’s economies. Other charts highlight the growing demand AI places on our energy systems, as well as the widening gap between poorer countries, fragile states, and more advanced economies. The final figure shows foreign direct investment reaching a record, underscoring the scale of cross-border investment even amid a challenging global environment.
Together, these visuals offer a snapshot of how global economic conditions evolved over the year and where some pressures are becoming more pronounced. Scroll through the charts below to revisit the data and insights.
This article was originally posted here.
4 Comments
The Netherlands 2nd in inward foreign direct investment. Anybody know why?
I don't have an answer but I was curious about that too. Luxembourg is also very high, the per capita chart must be crazy.
Perhaps the elite see ti as a more preferable safe haven for if there's a shift form the USD. Historical confidence?
Spend a month or two floating around the canals and rivers of the Netherlands. You'll see how family businesses have constantly upgraded and adapted. With support from their Government. The big N has also focused on niche markets and invested heavily in their young people - most of whom would rather stay and (many) still draw comfort and inspiration from closeness to their extended family. The Netherlands marine construction industry is a star - they focus on high tech and niche areas like oceangoing tugs and rig support.
Strategically located to be sure (and part of the EU family), but the Netherlands is everything this country isn't when it comes to Government's thinking about why they are there.
a good fact, but that's trillions of dollars - me thinks tax haven stuff going on - here is chat GPT to help -
Why IMF numbers look insane (and technically aren’t wrong)
The IMF tracks financial control relationships, not factories.
So when ING:
-
Routes capital through Dutch entities
-
Centralizes treasury in Amsterdam
-
Recycles profits internally
👉 the Netherlands gets credit for the flow.
This is what economists politely call “financial hub effects”
and what critics call “phantom FDI.”
a good fact, but that's trillions of dollars - me thinks tax haven stuff going on - here is chat GPT to help -
Why IMF numbers look insane (and technically aren’t wrong)
The IMF tracks financial control relationships, not factories.
So when ING:
-
Routes capital through Dutch entities
-
Centralizes treasury in Amsterdam
-
Recycles profits internally
the Netherlands gets credit for the flow.
This is what economists politely call “financial hub effects”
and what critics call “phantom FDI.”
a good fact, but that's trillions of dollars - me thinks tax haven stuff going on - here is chat GPT to help -
Why IMF numbers look insane (and technically aren’t wrong)
The IMF tracks financial control relationships, not factories.
So when companies:
-
Routes capital through Dutch entities
-
Centralizes treasury in Amsterdam
-
Recycles profits internally
the Netherlands gets credit for the flow.
This is what economists politely call “financial hub effects”
and what critics call “phantom FDI.”
A good fact, but that's trillions of dollars - me thinks tax haven stuff going on - here is chat GPT to help:
Why IMF numbers look insane (and technically aren’t wrong) - The IMF tracks financial control relationships, not factories.
So when companies:
- Routes capital through Dutch entities
- Centralizes treasury in Amsterdam
- Recycles profits internally
the Netherlands gets credit for the flow.
This is what economists politely call “financial hub effects”
and what critics call “phantom FDI.”
We welcome your comments below. If you are not already registered, please register to comment
Remember we welcome robust, respectful and insightful debate. We don't welcome abusive or defamatory comments and will de-register those repeatedly making such comments. Our current comment policy is here.