This table outlines the New Zealand Government's planned spending for the 2019/20 budget year.
Actual spending for the previous four years is on the left.
The numbers are drawn together from data released by the Minister of Finance on May 30, 2019.
Links to the primary sources used, from Treasury's website, can be found at the bottom of the page.
Click on any heading to drill down to what makes up these numbers. Figures for each allocation are in millions of NZ$.
| Actual 2014/2015 | Actual 2015/2016 | Actual 2016/2017 | Actual 2017/2018 | Actual 2018/2019 | Estimate 2019/2020 | % | |
| NZ$m | NZ$m | NZ$m | NZ$m | NZ$m | NZ$m | ||
| 192.3 | 193.3 | 197.5 | 214.1 | 249.0 | Customs | 241.7 | 0.2 |
| 175.1 | Forestry | 277.1 | 0.3 | ||||
| 283.2 | 274.6 | 326.6 | 286.0 | 342.3 | Arts, Culture and Heritage | 364.1 | 0.3 |
| 214.0 | 240.9 | 291.8 | 306.9 | 346.1 | Maori Development | 374.2 | 0.3 |
| 165.7 | 474.8 | 176.1 | 305.0 | 401.6 | Treaty Negotiations | 408.1 | 0.4 |
| 219.5 | 216.3 | 292.3 | 251.6 | 400.2 | Lands | 494.0 | 0.4 |
| 438.5 | 529.9 | 525.1 | 504.5 | 531.8 | Justice | 545.7 | 0.5 |
| 442.1 | 441.8 | 456.3 | 448.8 | 530.7 | Foreign Affairs and Trade | 589.7 | 0.5 |
| 392.2 | 416.6 | 440.0 | 441.1 | 496.2 | Conservation | 600.6 | 0.5 |
| 546.1 | 556.3 | 625.0 | 687.8 | 721.9 | Internal Affairs | 721.0 | 0.7 |
| 399.2 | 227.5 | 299.6 | 253.3 | 446.6 | Defence | 766.0 | 0.7 |
| 643.7 | 673.5 | 690.8 | 710.4 | 773.3 | Courts | 819.7 | 0.7 |
| 568.2 | 592.1 | 592.2 | 707.0 | 770.6 | Official Development Assistance | 822.2 | 0.7 |
| 629.9 | 703.9 | 719.3 | 939.7 | 1,074.3 | Agriculture, Biosecurity, Fisheries and Food Safety | 848.8 | 0.8 |
| 254.7 | 295.7 | 442.8 | 876.8 | 717.4 | Environment | 995.0 | 0.9 |
| 156.6 | 863.8 | 1,020.7 | Oranga Tamariki | 1,198.6 | 1.1 | ||
| 1,360.5 | 1,532.7 | 1,704.3 | 1,874.4 | 2,010.3 | Labour Market | 2,041.0 | 1.8 |
| 1,595.7 | 1,626.3 | 1,679.9 | 1,757.3 | 2,090.8 | Police | 2,047.6 | 1.8 |
| 1,493.4 | 1,543.3 | 1,601.7 | 1,741.3 | 2,259.5 | Corrections | 2,171.7 | 2.0 |
| 1,313.6 | Housing and Urban Development | 2,228.1 | 2.0 | ||||
| 2,999.8 | 3,029.6 | 2,991.8 | 3,104.1 | 3,330.6 | Tertiary Education | 3,487.9 | 3.1 |
| 1,963.7 | 2,068.2 | 1,934.3 | 2,252.5 | 2,840.4 | Business, Science and Innovation | 3,851.9 | 3.5 |
| 2,983.1 | 2,876.2 | 3,010.8 | 3,141.5 | 3,607.7 | Defence Force | 4,291.2 | 3.9 |
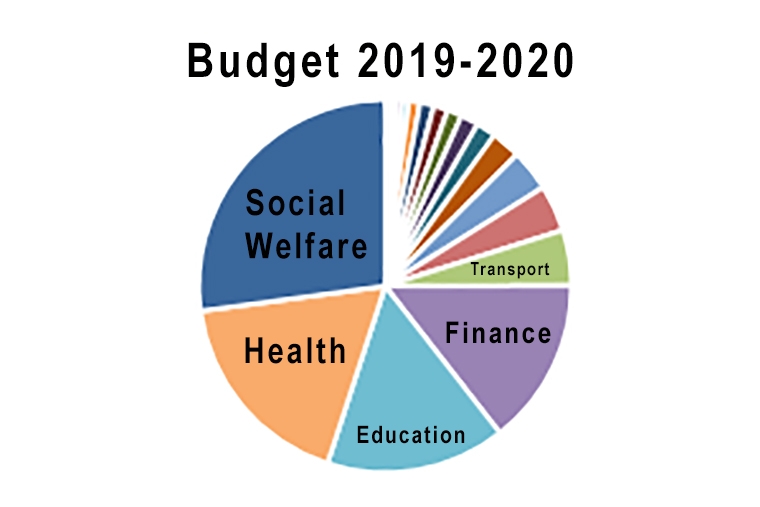
| 3,959.3 | 3,514.6 | 3,667.9 | 5,017.0 | 5,639.6 | Transport | 5,791.9 | 5.2 |
| 5,308.8 | 7,097.4 | 5,307.7 | 5,127.8 | 5,509.3 | Finance | 6,149.9 | 5.6 |
| 6,064.9 | 5,696.8 | 5,663.7 | 5,706.7 | 6,732.2 | Revenue | 7,046.6 | 6.4 |
| 10,243.6 | 10,741.7 | 11,094.7 | 11,590.4 | 12,153.4 | Education | 12,609.5 | 11.4 |
| 15,033.7 | 15,279.8 | 18,395.0 | 16,524.8 | 17,809.8 | Health | 19,870.6 | 17.9 |
| 23,221.3 | 23,978.9 | 24,861.5 | 22,831.4 | 25,864.8 | Social Development | 27,828.6 | 25.1 |
| 83,200.2 | 86,218.5 | 89,455.5 | 92,134.7 | 102,164.2 | Grand Total | 110,785.6 | 100.0 |
| 244,795 | 257,151 | 273,377 | 288,838 | 305,173 | GDP (nominal, per RBNZ) | 322,432 | |
| 34.0% | 33.5% | 32.7% | 31.9% | 33.5% | Govt spending - % of GDP | 34.4% | |
| and this compares with taxes collected as follows: | |||||||
| 83,199.9 | 88,230.7 | 93,623.8 | 98,044.5 | 103,857.1 | 109,860.1 | ||
Sources: You can download the data behind these tables from the NZ Government website here.
2 Comments
Suraj - they sure keep you busy. But a useful set of tables for the layman. How can tax take increase by ~5% every year since 2014 when I doubt our family income has increased that fast? Is it population growth plus inflation?
From here we can see the difference on the 2020 budget allocations. Pandemic really helped us manage stuff more effectively, which one to focus on. I am glad that both health and social welfare was given a fair amount of allocation it needed.
Even us at work, we insure that health is the priority.
Sending our gratitude as a team!
Jack M.
North Shore Auckland
plumbing north shore
We welcome your comments below. If you are not already registered, please register to comment
Remember we welcome robust, respectful and insightful debate. We don't welcome abusive or defamatory comments and will de-register those repeatedly making such comments. Our current comment policy is here.