

Did we go too far this time?
That's the nagging question I have. Unfortunately, it's going to take at least 12-24 months to even begin to know the answer.
But it's nagging.
Has the latest enormous property buying bender been the one that finally brings us unglued?
I've found two recent RBNZ-sourced graphs to be a source of great discomfort. And I run them here side-by-side. (Click on the little magnifying glass logos to see them in full-sized glory.) I have previously written about both graphs, see here and here.
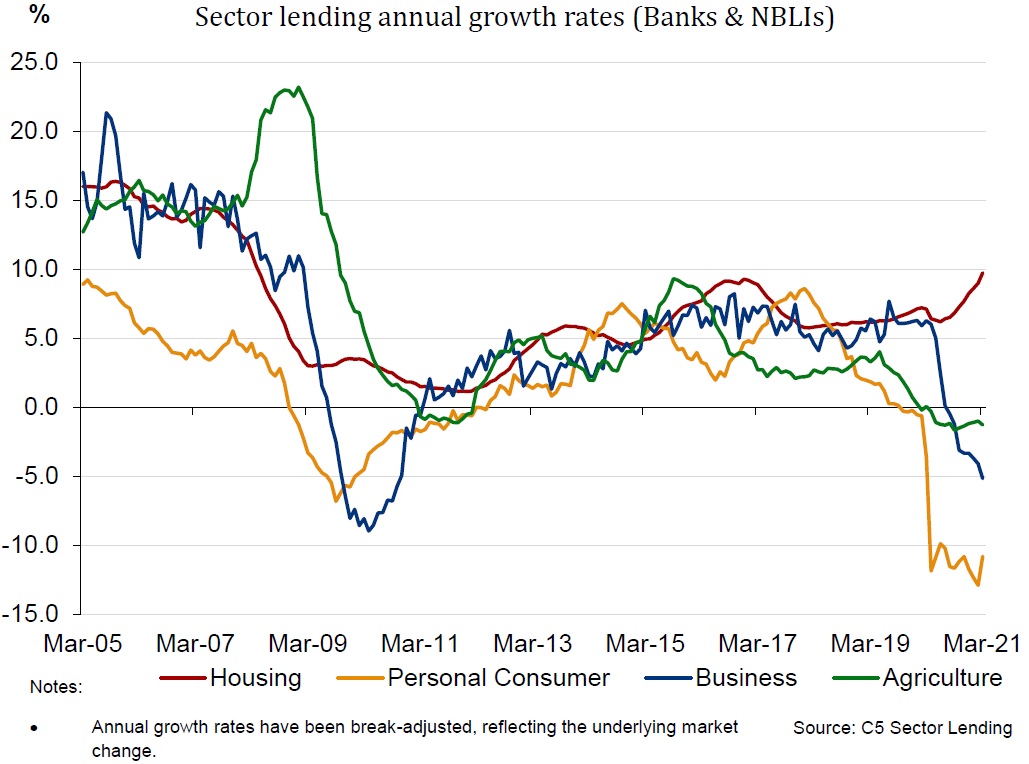
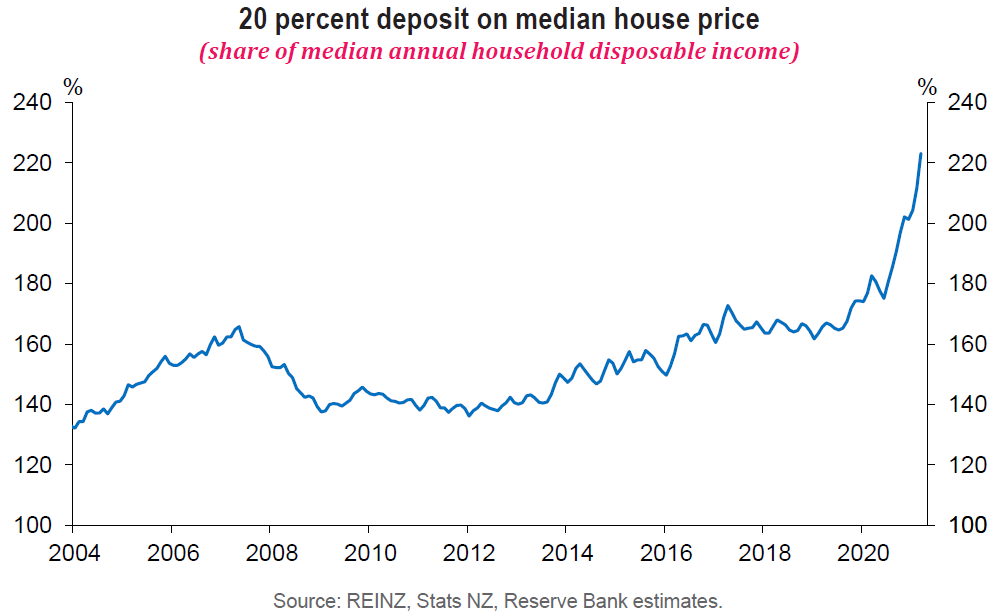
The two graphs are not directly related, as such. But they both show an interesting and disturbing fact; we've broken from historic patterns. Well and truly.
The graph on the left shows our housing market has effectively disconnected itself from the rest of the economy.
The graph on the right is, I think even more disturbing.
Frankly I was quite surprised to see, reading the detailed stats that went into the graph, going back to the start of 2004, that a 20% deposit on a median house had never taken up more than 175% of disposable household income - till February of last year. And now its up over 220%.
Hot markets
Remember, that 2004-2021 timeframe takes in some pretty hot housing markets, notably the mid 2000s and the mid 2010s. But even during those times the deposit to income ratios stayed generally within a range. Now we've broken right out of it.
The big difference is the super-low interest rates now.
We know, quixotically, that even as the amounts of debt taken on have become more eye-watering, so, the ability to service the debt has become easier.
According to the RBNZ's key household financial statistics, in 2020 interest servicing costs took up just 6.2% of household disposable income. That's an all-time low in a data series that goes back to 1999. And that 6.2% figure compares with over 9% during the mid-2010s housing boom and well over 10% (and hitting a peak of 13.7%) during the mid-2000s housing boom.
Here's a key quote from the RBNZ's recently released Financial Stability Report:
House prices seem less sustainable than before the recent rise for several reasons. Larger house deposits are needed to get into the market and this is making it difficult for first home buyers (FHBs). The Government’s recent changes to the bright-line property tax and to interest deductions from rental income will dampen investor demand for housing over time. While the interest costs on mortgages are low and interest rates have generally fallen more than rental returns, interest rates could rise if the economy continues to strengthen and inflationary pressure builds.
Ah, if inflationary pressure builds...
The RBNZ has given some examples of the impact rises in mortgage rates could have.
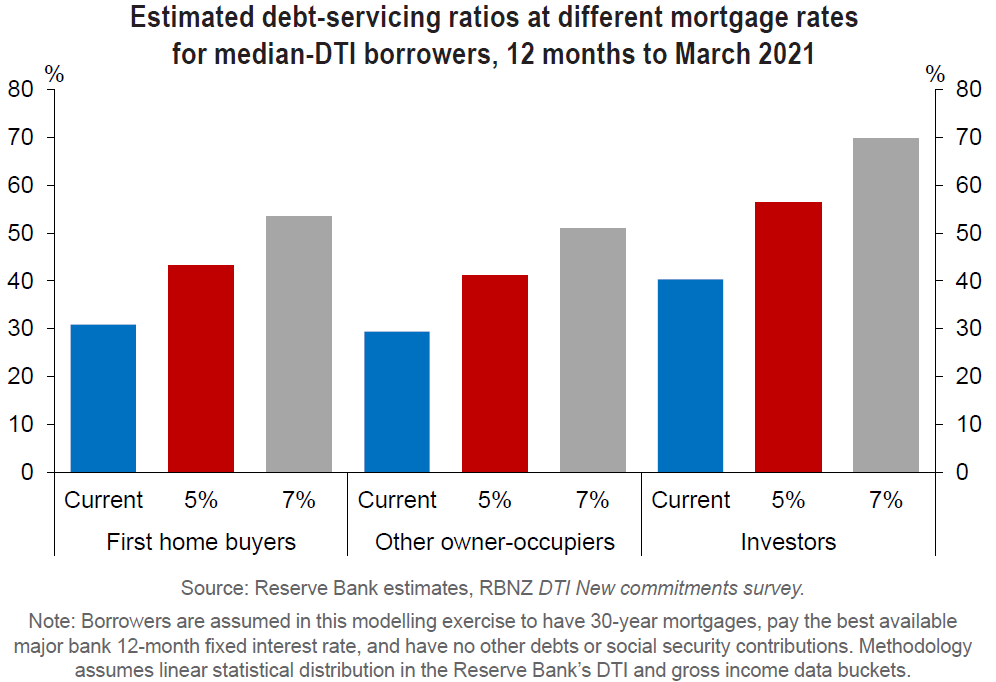
First home buyers could, in this example, see their mortgage costs rise from a little over 30% of disposable income now, to 43% with an interest rate of 5%, and up to well over 50% of disposable income with mortgage rates of 7%. And 7% is not a far-fetched figure. One-year fixed rates were just a touch under 10% just before the global financial crisis in 2008.
The figures for other owner-occupiers are fairly similar, while as the graph shows, the rises are more extreme for investors. They would see the share of disposable income go from 40% now to 56% at a 5% mortgage rate and 70% on a 7% rate.
So, that's a bit scary.
How possible is such a scenario?
Well, it really depends on inflation.
Central banks around the world are attempting to convince everybody (and themselves?) that the current pricing pressures we are seeing - largely as a result of supply chain disruptions due to Covid - will be temporary.
Collectively central banks at the moment seem happy to let economies run a little 'hot', firstly to let them recover from the Covid shock and secondly, to allow the central banks time to be convinced that the levels of inflation they would like to see (IE in NZ it's 2%) would be locked in and not just fade away as has been recent history.
Will this time be different though?
Considerable pressure
The pricing pressures that are being seen globally, and that can be observed in NZ (note the latest ANZ Business Outlook Survey) are considerable. Central banks are trying to 'look through' them, but will the people paying these higher prices 'look through' them? Does this wave of inflation lead to a secondary wave of inflation as the response from those on the end of higher prices is to raise their prices? And does that then lead into higher (also inflationary) wage expectations?
If the inflationary genie really got out of the bottle, the only logical response would be interest rate hikes.
If the RBNZ was faced with such a scenario it would really be in a jam. Mortgage holders would be much more affected by rises in interest rates from these historically low levels than they have been at other times of rising rates.
So, it remains to be seen if the great post-lockdown buying spree of 2020 (and running into 2021) was one spree too many.
We've once again doubled down on the housing market. And we are potentially exposed.
Let's hope the central banks are right about the current wave of inflation being temporary...

We welcome your comments below. If you are not already registered, please register to comment
Remember we welcome robust, respectful and insightful debate. We don't welcome abusive or defamatory comments and will de-register those repeatedly making such comments. Our current comment policy is here.