By Shane Martin & David Norman*


• Further, the population’s preference is for fewer people per dwelling (PPD) than in the past. This means that, all else equal, housing supply actually needs to grow faster than the population to keep prices stable.
• In slow-growing areas of the country, prices have remained subdued as house supply has easily kept up. But in Auckland, prices have risen sharply because too few houses have been built relative to the massive population growth, despite a large amount of land available to develop through the Unitary Plan.
• Simply, a slow response in housing supply rather than lagging technical land availability explains much of the house price growth.
A mixed bag of house price growth
Across all 47 cities and districts in New Zealand with a complete house price data set1, house prices grew significantly from the turn of the century until the Global Financial Crisis (GFC) in 2007. Still, growth varied from 75% to 190%.
During and after the GFC, however, widespread growth did not continue. In areas like Auckland, Queenstown, Selwyn, and Tauranga, prices continued to rise strongly. Conversely, areas like Clutha, Gisborne, South Taranaki, and Whanganui saw broadly flat prices between 2007 and 2016. What has driven this divergence across New Zealand post-GFC?
As always, supply and demand
As with any product, the price of housing is determined by supply and demand. We would expect that as population grows, the demand for housing would increase and put upward pressure on prices. Or if demand for housing is sufficient, as interest rates go down, prices will rise.
On the other hand, as housing supply increases, downward pressure on house prices is created. The interplay between these phenomena (and other unobserved trends) determines the market price. These are not profound insights, but our work has determined how much of the house price changes can be explained by these attributes.
By using an econometric model of house prices, we were able to measure the impacts of population, housing, and interest rate trends to help explain growth in house prices in Auckland and the rest of the country.
What’s the deal with Auckland?
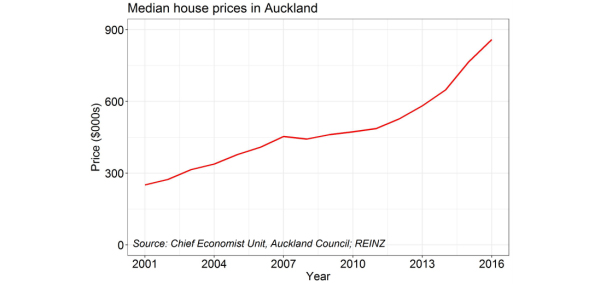
Over the past 16 years, Auckland’s median house prices have increased from the mid-$200,000s to over $850,000. Since the GFC, Auckland has had the highest growth rate in house prices in New Zealand, and saw absolute growth of around $405,000 in median prices between 2007 and 2016.
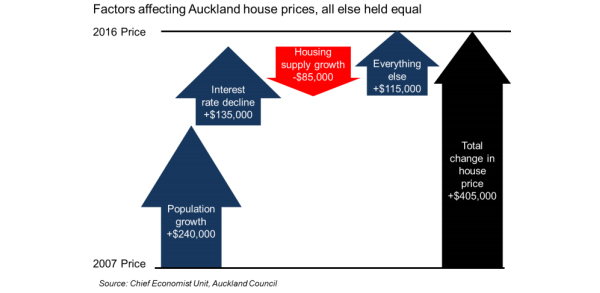
How much of Auckland’s house price growth can be explained by the three factors of population growth, interest rates, and housing supply growth? In Auckland, the population increased by 17% between 2007 and 2016. On its own, this would imply a $240,000 price increase, all else held equal.
Interest rates on mortgages declined massively between 2007 and 2016 – from an effective mortgage rate2 around 8.5% in 2008 to below 5% by the end of 2016. Our analysis shows that this fall in interest rates allowed a $135,000 increase in house prices without mortgage repayments rising, given the extent to which the supply of housing did not meet demand in Auckland.
The housing stock has risen, albeit not fast enough. Between 2007 and 2016, it increased an estimated 11%. This increase in housing stock reduced price growth by $85,000, all else held equal, in Auckland. But in summary, housing stock has simply not grown fast enough to keep up with demand from:
• a burgeoning population
• a preference for fewer PPD, not more
• higher bid prices due to lower interest rates.
Where are enough houses being built?
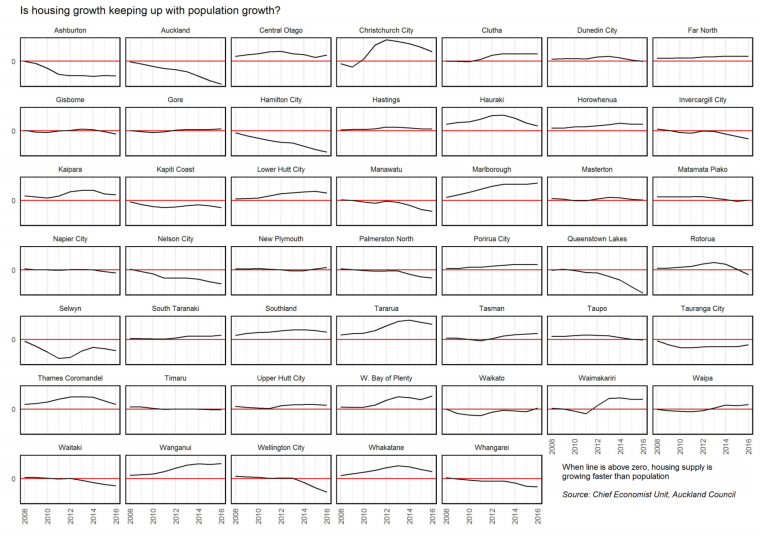
Areas where lots more people want to live have not been able to raise supply fast enough, while those with weaker population demand have been able to cope better, slowing price rises. As of 2016, Auckland has the second highest gap between the rates of population growth and housing supply growth in New Zealand. Guess where it’s worst: Queenstown, where house price growth has been roughly as sharp as Auckland’s.
And the five areas in New Zealand with the largest price increases over the past 10 years have all seen house supply growth slip behind population growth. In contrast, four of the five areas with the lowest price increases have had stronger house supply growth than population growth.
Overall, housing supply has kept pace with population in 27 of the 47 areas we evaluated. In these areas, the average house price is about 20% higher in 2016 than it was in 2007 (suggesting unmet demand for fewer PPD). In the other 20 areas, the average price increased about 30%. It’s clear that the relative growth of housing supply and population significantly affects house prices.
You can’t live in a resource consent
Rapid house price rises in high growth areas like Auckland have led to debate about the root cause of the increases. Some have suggested that land use regulation may be the largest contributor to inflation in Auckland and elsewhere. But the evidence across the country supports the conclusion that land use regulation is unlikely to be the main culprit for house price rises.
To point the finger at land use regulation would imply that all the areas with the largest population increases have the worst land use regulations and those with the smallest gains have the best regulations.
Perhaps something else is at play?
Our findings in Auckland (which we can replicate for all 47 areas examined) suggest that population growth, housing stock growth, and falling interest rates explain about $290,000 of the $405,000 increase in house prices between 2007 and 2016. The other $115,000 is due to everything else.
“Everything else” may include land use regulation, but is also due to:
• unmet demand for fewer PPD
• household income growth allowing people to bid up prices due to unmet demand
• construction cost increases and capacity constraints
• changes in the relative productivity of land in Auckland compared to other areas
• all the amenities that draw people to Auckland instead of other parts of New Zealand. While excessive land use regulation no doubt puts upward pressure on house prices, land supply is not housing supply, as we pointed out here.
Council, the Reserve Bank and the Ministry of Business, Innovation and Employment have all estimated Auckland’s housing shortfall at between 43,000 and 55,000 and growing. The Auckland Unitary Plan allows for up to one million potential new dwellings. Yet the plan was implemented a year ago, and there is no evidence of decreasing land prices.
Put another way: If having already zoned to develop 20 times the current housing shortfall is not bringing land prices down at all, can land use regulation in Auckland be the major cause of high house prices?
In the case of Auckland at least, the answer is simple: You can’t live in a resource consent. It is because not enough houses are being built fast enough (for a range of reasons), rather than just the technical availability of developable land, that is keeping prices up. Land may be resource consented for development, but until houses are actually built on it, a premium will be placed on houses that are available.
How we did it
An annual dataset consisting of median house prices, population, housing stock, and interest rates for 47 territorial authorities (TAs) was created. A two-way fixed-effects model was estimated to assess the impacts of population growth, housing stock growth, and interest rate trends on house prices. This model controls for the named variables, idiosyncratic TA effects, and time effects.
1) Monthly house price data was available between 2001 and 2016 for 46 of the 47 Territorial Authorities (TAs) that had a population of at least 15,000 over that time period, the exception being the South Waikato District. Complete data was also available for the smaller Gore District, making an analysis possible for 47 of the 67 TAs in New Zealand, covering over 95% of the population.
2) It should be noted that whichever rate is used (floating first mortgage, effective floating mortgage, effective fixed mortgage, or effective mortgage), the trend is nearly identical.
*Shane Martin is an economist in the chief economist unit & David Norman is chief economist at the Auckland Council. This article is published with permission.
We welcome your comments below. If you are not already registered, please register to comment
Remember we welcome robust, respectful and insightful debate. We don't welcome abusive or defamatory comments and will de-register those repeatedly making such comments. Our current comment policy is here.