

It's the information you've possibly been waiting for.
And it's suitably eye-opening.
The Reserve Bank has introduced a new data series called New Residential Mortgage Lending by Purpose, which will now be run every month.
The great thing about this series is that while it is debuting this month with data for July 2023, the figures go back all the way to 2017, so there's time to see some trends.
The RBNZ has, helpfully provided a summary of some of the key points, along with a number of graphs, some of which I'm reproducing here.
I know from writing articles about other RBNZ monthly data series that a common question among readers is: Yes, but are these all 'new' mortgages and what about people topping up, or moving lenders?
Well, here we go. We need ask no longer.
For those who wondered, yes, 'top-ups' have been a hugely significant part of the monthly mortgage figures, as have people swapping lenders. (To get the best out of the two graphs below, click on the little magnifying glass logo on the top right of the right-hand-side graph).
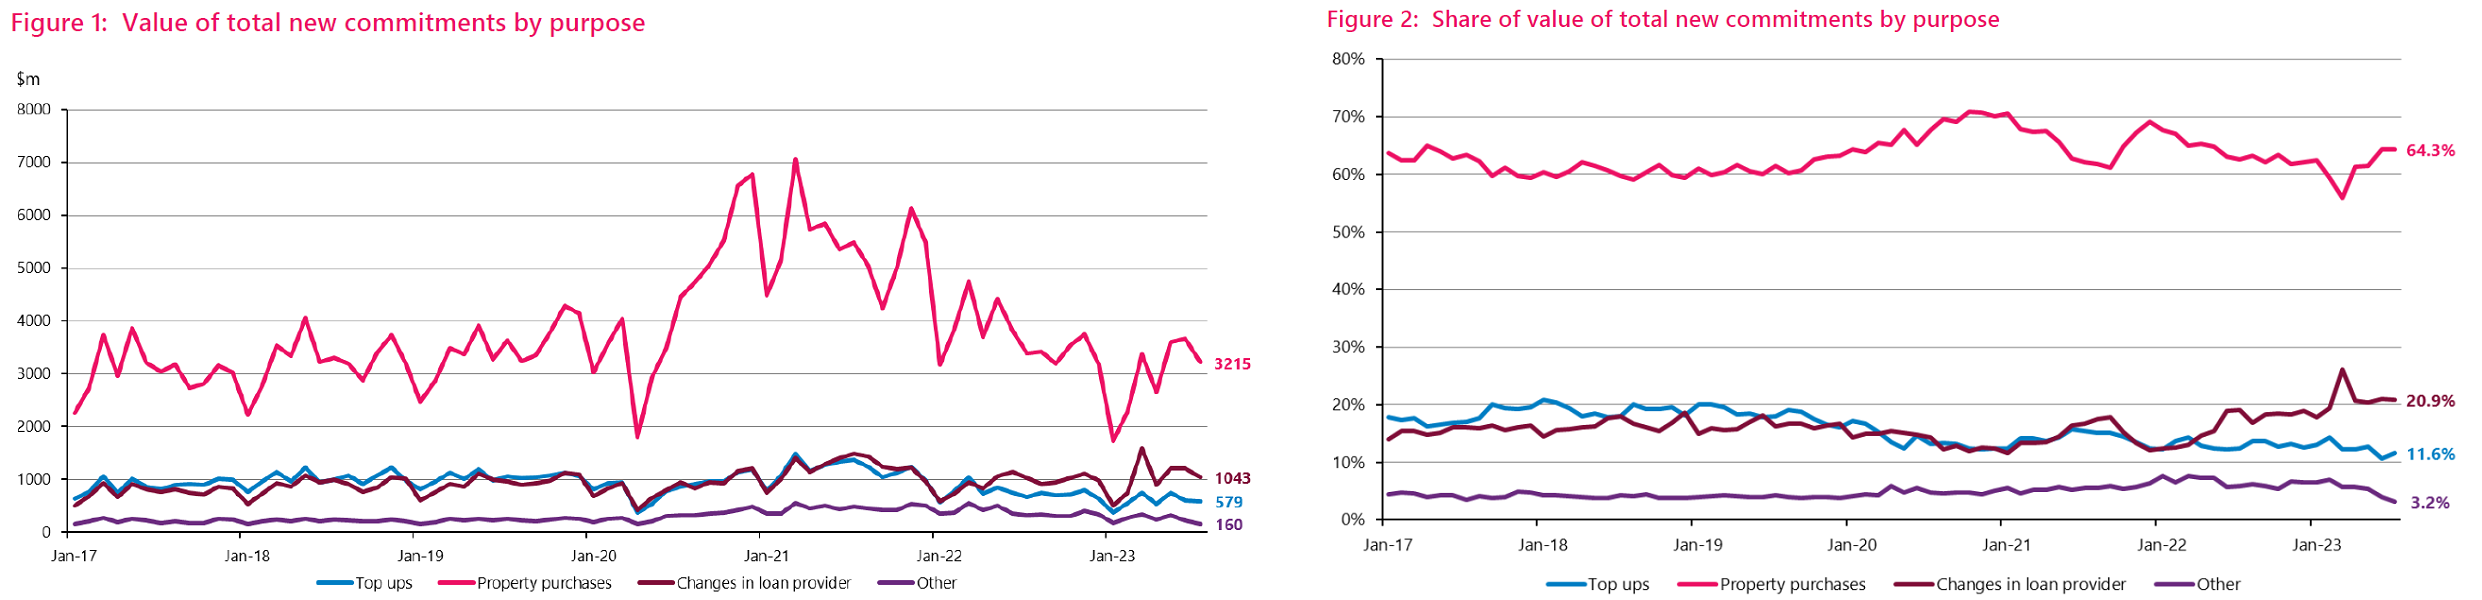
Until very recently, top-ups made up more than half of the total new mortgage commitments by number, which surprises me. It might not surprise you.
It was only in June of this year (remember this data series goes back to 2017) that for the first time the number of mortgage commitments that were for top ups was actually smaller than the number of mortgage commitments that were for house purchases.
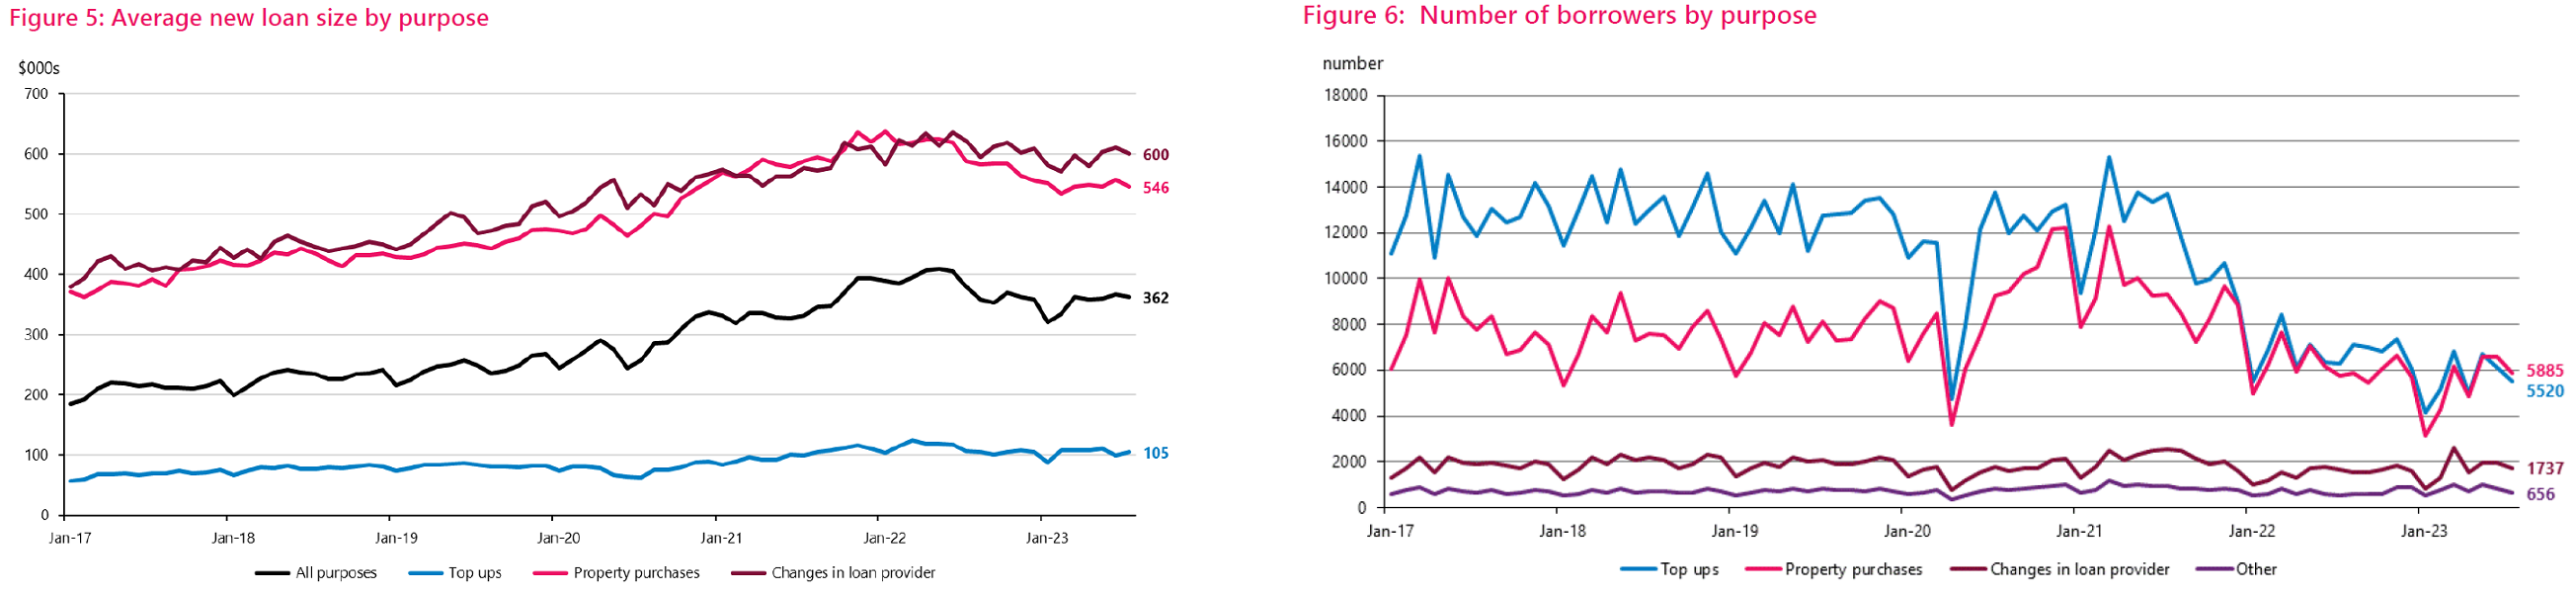
And this was again the case in July 2023, when by number there were 13,795 new commitments, of which 5886 were for purchases of houses, 5520 for top-ups, 1737 for changing lenders and 656 'other', which includes among other things bridging finance.
If we go back two years, to July 2021, of a total number of mortgage commitments of 26,573, some 13719 (over half) were for top-ups. If we look at July months going back to 2017, the percentage of commitments that were for top ups has ranged between 40% (the latest July) and 55.1% in July 2018. In terms of mortgage commitments to actually buy a house, that's ranged from 32.3% in July 2018 to 42.7% in July 2023.
In dollar terms the amount for top ups in July 2023 was just $579 million, which is 11.6% of the $4.997 billion advanced during the month. And yes that's the lowest percentage in terms of July months in this data series, although up from the all-time low of 10.7%, which was recorded in June 2023. The highest figure for July months was 18% in both July of 2018 and 2019. If we go back to July 2021, when there was a grand total of $8.818 billion borrow, some $1.365 billion of that was for top-ups.
In terms of the average size of those top ups, in recent times they've been averaging over $100,000. (Again, click on magnifying glass logo to see full-sized graphs).
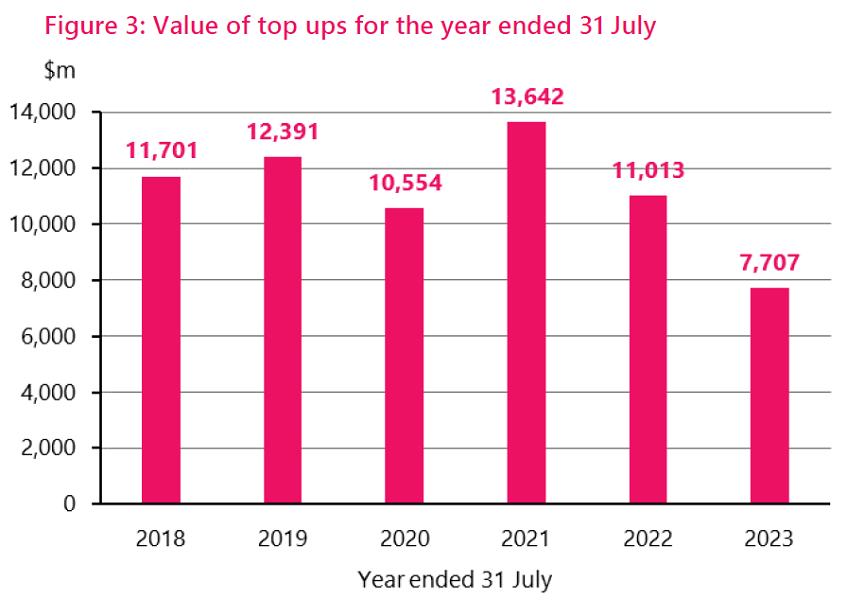
This below graph demonstrates just how much, relatively, the idea of using the home as an ATM is, for now, losing favour.
While top-ups have lost their lustre, what has become more popular - and no surprises really given the current high interest rates - is swapping mortgage lender.
In July 2023, just over $1 billion (20.9% of the total mortgage monies advanced) represented mortgages that were shifting lenders. That's the highest percentage for a July month going back to the start of this data series. And yes, the number of mortgage commitments shifting lenders (1737) is also at a high for a July of 12.6%.
So, there we go, there's much more that could be said, but it will be interesting to track these figures month by month.
What we probably can say is that the latest trends show both the impact of the falling house prices and the rising mortgage rates.
Clearly, grabbing a mortgage top-up when the price of your house is going up would seem more logical, while equally, moving your mortgage lender when rates are high and banks are competing for the business would appear sound logic.
One interesting point to make about this new data series is that it gives us a clearer picture of how prevalent the first home buyers are at the moment when it comes to new purchases.
We know from the mortgages by borrower type series that the RBNZ also produces that in July 2023 the FHBs, with over $1.2 billion borrowed, made up a new high share of the total mortgage money committed of just under 25%.
But, interestingly, if we look at the new data series, we can see that of the $4.997 billion total advances during July 2023, just $3.215 billion was for house purchases.
Based on that then, the over $1.2 billion borrowed by the FHBs actually made up nearly 40% of the total advanced for house purchases.
We will for sure be tracking these new figures, which are another welcome addition to the RBNZ's burgeoning collection of crunchy mortgage data series.
We welcome your comments below. If you are not already registered, please register to comment
Remember we welcome robust, respectful and insightful debate. We don't welcome abusive or defamatory comments and will de-register those repeatedly making such comments. Our current comment policy is here.