

The mortgage market has had its strongest start to a year for four years in 2025.
I've had a crunch of the Reserve Bank (RBNZ) monthly mortgage figures up to the end of March. Using mostly the C33 monthly residential mortgage lending by purpose figures, I've compiled first-quarter figures for 2025 and going back to 2017, which was the start of this particular data series.
The data shows that whether you look at the amount of mortgage money advanced, or the number of mortgages, first-quarter 2025 has been the busiest start to the year for the mortgage market since the super-hot first quarter of 2021. (March 2021 was the biggest ever month for mortgages by value with $10.487 billion worth committed.)
I've also done a break-down of the three major categories included in the overall figures, namely mortgages specifically for a house purchase, changes of loan provider, and top-ups.
There's a few general observations worth making.
Breaking down the figures into the various categories highlights the extent to which the 'top ups' category tends to skew the overall figures.
This is particularly the case when we look at the average-sized mortgage.
The first quarter figures between 2017 and now show that in that period the average size of top up has ranged from $62,000 (in 2017) to $115,000 in 2022. Top-ups have by number always been the biggest individual category. This category made up 23,533 (45%) of the 52,323 total of all mortgages in the March 2025 quarter.
Generally, the percentage of top ups (at least in the first quarter of years) has been been declining in recent years. In the first three months of 2018 this category made up as much as 58.6% of the mortgages by number. However, in the March 2025 quarter, top-ups made up just under 45% of the number of mortgages. The 23,533 top-ups in March quarter 2025 was down 40.6% compared with the 39,628 top-ups in March quarter 2017.
| TIME FOR A LITTLE TOP-UP - MORTGAGE TOP-UPS | |||
|---|---|---|---|
| First quarter - Jan-Mar | Top-up - amount | Number of mortgages | Average amount* |
| 2025 | $2.276bn | 23,533 | $97,000 |
| 2024 | $1.733bn | 18,706 | $93,000 |
| 2023 | $1.654bn | 16,149 | $102,000 |
| 2022 | $2.405bn | 20,879 | $115,000 |
| 2021 | $3.341bn | 36,834 | $91,000 |
| 2020 | $2.961bn | 34,161 | $87,000 |
| 2019 | $2.905bn | 36,732 | $79,000 |
| 2018 | $2.864bn | 38,903 | $74,000 |
| 2017 | $2.450bn | 39,628 | $62,000 |
| *Average amount figures rounded to nearest 1000. Figures calculated from RBNZ C33 series, monthly residential mortgage lending by purpose. | |||
Please note with regard to all the tables in this article, that the RBNZ figures also include a small number of loans described as "other commitments". I've not broken down those "other commitments" figures here. The upshot is that the totals for house buying, changing provider and top-ups do not add up to the totals seen in the 'The lot - total of all mortgages for all purposes' table below.
So, about the mortgages for all purposes figures - IE all the committed mortgages in a month - here is the picture for the first quarter of each year since, and including, 2017.
| THE LOT - TOTAL OF ALL MORTGAGES FOR ALL PURPOSES | |||
|---|---|---|---|
| First quarter - Jan-Mar | All mortgages - amount | Number of mortgages | Average amount* |
| 2025 | $19.466bn | 52,323 | $372,000 |
| 2024 | $14.363bn | 41,052 | $350,000 |
| 2023 | $12.647bn | 36,805 | $344,000 |
| 2022 | $17.702bn | 45,413 | $390,000 |
| 2021 | $24.448bn | 74,320 | $329,000 |
| 2020 | $16.474bn | 63,452 | $260,000 |
| 2019 | $14.618bn | 64,300 | $227,000 |
| 2018 | $14.216bn | 66,359 | $214,000 |
| 2017 | $13.897bn | 70,258 | $198,000 |
| *Average amount figures rounded to nearest 1000. Figures calculated from RBNZ C33 series, monthly residential mortgage lending by purpose. | |||
And here, courtesy of the RBNZ's website, is what the break down of the above figures looks like on a month-by-month basis.
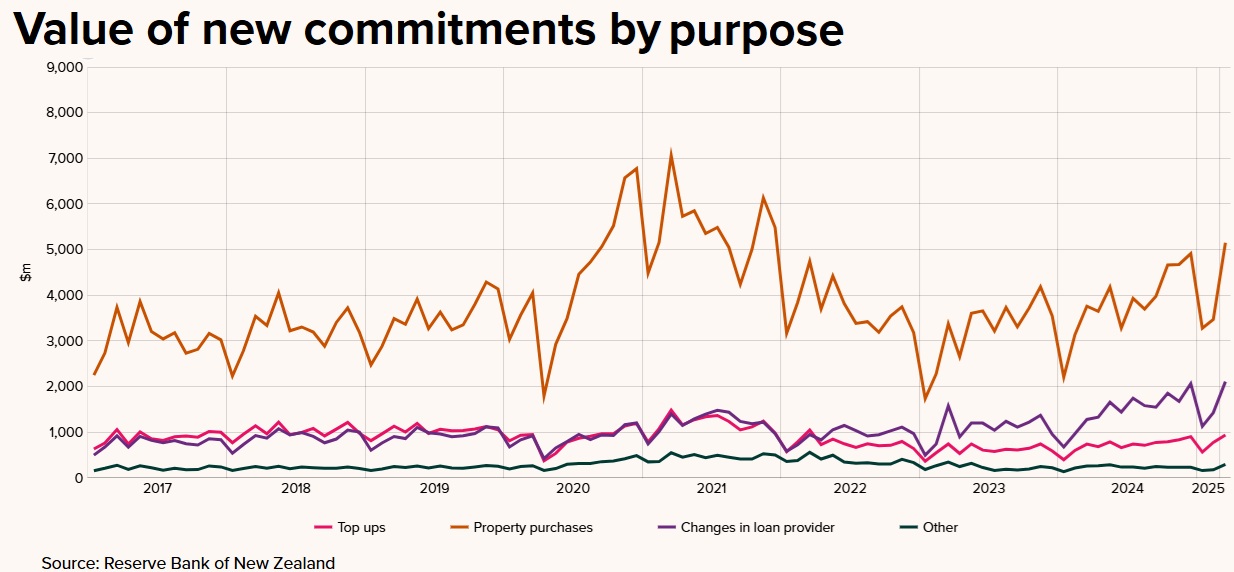
The effect of the top-ups on the overall figures has tended to mask just how large mortgages have become in New Zealand.
In the March quarter 2025 the 'average' mortgage - but including top-ups - was $372,000. And while a lot of people might say $372,000 is plenty big enough for a mortgage, really, it's nothing.
If we look at the figures for just house purchases in the March 2025 quarter, well the average figure was $582,000 - and that's among a sample size of more than 20,000 mortgages, so, it is very much a true representation of the sizes of mortgage being taken up.
Meanwhile the other distortion the inclusion of the top-ups in the overall mortgage figures brings is that it has tended, arguably, to overstate the downturn seen in the mortgage market in the past few years.
Nobody doubts business has been quiet, but if we look at the figures for mortgages deployed for actually buying a house, then it's not quite as quiet as might have seemed.
And here those figures are...
| BRINGING IT HOME - MORTGAGES FOR BUYING A HOUSE | |||
|---|---|---|---|
| First quarter - Jan-Mar | House purchase - mort amount | Number of mortgages | Average amount* |
| 2025 | $11.897bn | 20,431 | $582,000 |
| 2024 | $9.101bn | 16,482 | $552,000 |
| 2023 | $7.389bn | 13,601 | $543,000 |
| 2022 | $11.750bn | 18,872 | $623,000 |
| 2021 | $16.704bn | 29,328 | $570,000 |
| 2020 | $10.646bn | 22,541 | $472,000 |
| 2019 | $8.839bn | 20,574 | $430,000 |
| 2018 | $8.551bn | 20,448 | $418,000 |
| 2017 | $8.716bn | 23,591 | $369,000 |
| *Average amount figures rounded to nearest 1000. Figures calculated from RBNZ C33 series, monthly residential mortgage lending by purpose. | |||
We can see that the numbers of mortgages certainly dipped in 2023 and 2024. But the tally for the March 2025 quarter actually compares reasonably with numbers in prior years apart from the March 2021 quarter, which is just out there on its own. The numbers of mortgages taken out in first quarter 2025 to buy a house are, for example, virtually the same as the numbers seen immediately pre-covid, in 2018 and 2019.
We can see that over the duration of this table, the average amount per mortgage has risen by $214,000 (from $369,000 in 2017 to $582,000 in the March quarter 2025).
During that same period, the median house price has risen by $244,000. So, perhaps its simplistic to say it, but the $244,000 rise in median house prices since 2017 is being paid for by homeowners by them on average taking on $214,000 more debt. So, simplistic logic, but our house price rises are paid for largely by us taking on more debt, not by us magically finding more savings.
It's little wonder that with such large mortgages, when coupled with the rate rises we saw between 2021-24, the idea of changing loan provider has increasing appeal. People are prepared to 'shop around' - and when we look at the size of the mortgages being switched, it's hardly surprising. A $679,000 mortgage, even on the 'reduced' rate of 4.99% available today is still costing over $43,500 a year in repayments (assuming a 30-year mortgage).
| SWITCHING IT UP - MORTGAGES FOR CHANGE OF LOAN PROVIDER | |||
|---|---|---|---|
| First quarter - Jan-Mar | Loan provider change - amount | Number of mortgages | Average amount* |
| 2025 | $4.661bn | 6861 | $679,000 |
| 2024 | $2.922bn | 4496 | $650,000 |
| 2023 | $2.813bn | 4784 | $588,000 |
| 2022 | $2.254bn | 3707 | $608,000 |
| 2021 | $3.150bn | 5561 | $566,000 |
| 2020 | $2.428bn | 4784 | $508,000 |
| 2019 | $2.273bn | 5006 | $454,000 |
| 2018 | $2.192bn | 5081 | $431,000 |
| 2017 | $2.090bn | 5202 | $402,000 |
| *Average amount figures rounded to nearest 1000. Figures calculated from RBNZ C33 series, monthly residential mortgage lending by purpose. | |||
And there's going to be presumably plenty more action on the change of loan provider front across the rest of this year and into next, judging by the current composition of the outstanding stock of mortgages.
As of the end of March, 52.9% of the outstanding mortgage stock with either on floating rates or fixed for six months or less. That equates to just under $200 billion worth of mortgages that either need to be or can be reset by the end of September this year.
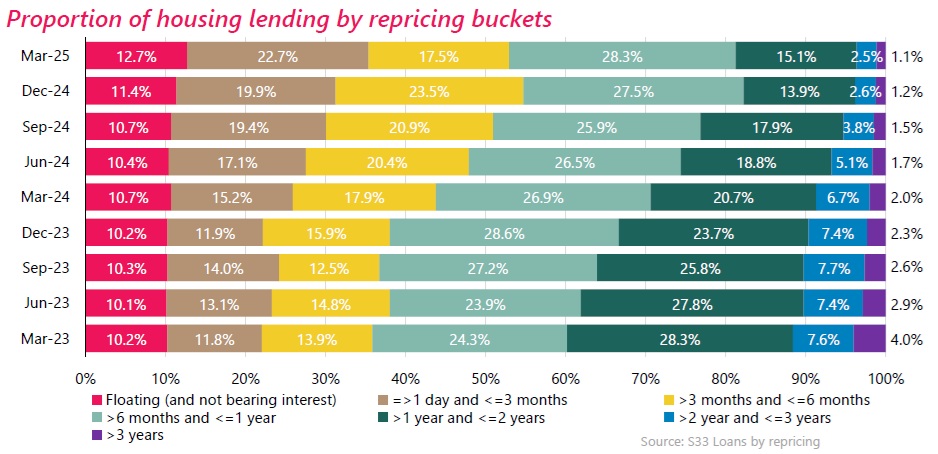
So, one way or another - whatever happens to house prices - it's shaping up to be a busy year for the mortgage business. A lot of people have a decision to make.
*This article was first published in our email for paying subscribers early on Friday morning. See here for more details and how to subscribe.
7 Comments
This is the best analysis I have seen in a long time, thank you.
So, simplistic logic, but our house price rises are paid for largely by us taking on more debt, not by us magically finding more savings.
This fact and DTIs are going to put the lid on house price rises, and limit them to somewhere near the difference of wage growth less inflation. Significant impact to investors who are often not even break even without capital gains. Without economic growth underpinning solid wage growth (and without rampant underlying inflation) we may not see much growth at all.
the banks will be well aware of this, and will compete hard to maintain or grow their books in a swapsies based market. I am not sure you can tell how much "new mortgage" numbers are people selling a house at one bank and mortgaging the next at a different bank?
I know its impossible to get but added interest if it could be done (and banks would be able to model it easily) is the duration of these and the age of the mortgage holder. We used to have the desire to get to low 60s and have the mortgage paid off, but with having kids later, and those kids often at local uni living at home, I wonder how many people have a strategy where they think its ok to have debt going into retirement and are planning to downsize at that point.
With what’s going on between the finance minister and the RBNZ, are DTIs going to survive?
DTIs are going to put the lid on house price rises
It's amazing how often this claim is made, without any real world evidence that DTIs squash house price rises. I wonder if the same claims were made before the introduction of LVRs.
All they do is make entrance into home ownership harder for the entry level/marginal buyer.
If you look at the DTI stats, what they mostly do is stop the marginal investor. There weren't that many FHBs buying houses at multiples above the high threshold we have in place, but there were quite a few investors doing so.
The maths is pretty simple, once your stereotypical mom and pop investor has bought a rental property or two, if they want to lever up to buy another their salary starts to get spread pretty thin between the mortgages, and a rental income of 5-6% does not go far in a DTI world.
Whether that will bring down prices in a noticable way I don't know, but it seems like a useful tool to me and would have taken the heat out of the covid house price insanity.
The euphoria between 2017 and 2021 is next level. We certainly love ticking it up on houses.
I would like to see the corresponding growth in household incomes placed alongside these tables.
Copy and paste data to chatGPT and ask.
We are all getting squeezed because:
Mortgage size +56% increase but income growth only increased approx 25% from 2017 to 2025
We are paying way more tax due to Tax bracket creep plus inflation means we pay more GST on goods and services as their prices are pushed up
House Value to income ratio has worsened from 2017 to 2025
Mortgage interest rates still high compared to 2017 to 2019
We welcome your comments below. If you are not already registered, please register to comment
Remember we welcome robust, respectful and insightful debate. We don't welcome abusive or defamatory comments and will de-register those repeatedly making such comments. Our current comment policy is here.