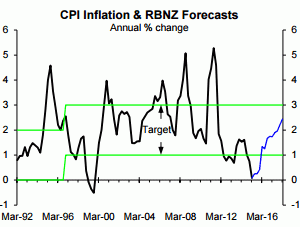
Calls for OCR cuts are based on the view CPI inflation, having fallen well below the bottom of Governor Wheeler's 1-3% medium-term target range (adjacent chart), will remain too low if economic growth and inflation aren't boosted by cuts.
Based on the March forecasts, the Reserve Bank expects inflation to rebound to around the mid-point of the target range (blue line) without OCR cuts, with Governor Wheeler having stated he is targeting 2%.
But in the April Policy Assessment the governor stated that:
It would be appropriate to lower the OCR if demand weakens, and wage and price-setting outcomes settle at levels lower than is consistent with the inflation target.
As covered in our pay-to-view reports, economic growth is strengthening rather than weakening, so the first of the governor's prerequisites for OCR cuts won't be met (i.e. "demand weakens").
However, could "wage and price-setting outcomes settle at levels lower than is consistent with the inflation target", because of "global deflation" or some other factors, even if economic growth remains robust?
Inflation is dead. Long live inflation
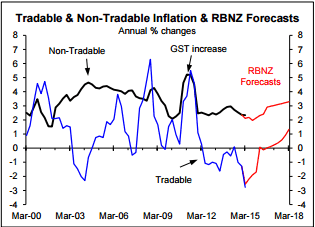
Tradable goods and services are those that are exported or imported and for which the exchange rate and international prices play a major part in determining local prices. Non-tradable goods and services are those that are largely produced and consumed locally and for which local demand-supply conditions play the major part in determining prices. The chart shows that most of the fall in CPI inflation has been due to tradable inflation turning quite negative, while nontradable has nudged lower but remains above 2%.
Negative tradable inflation could mean "global deflation" is behind low NZ CPI inflation and some bank economists have at times partly pointed the finger at global deflation (i.e. falling global prices in general, as distinct from just falling commodity prices). The real story is that three largely independent factors coincided and drove tradable inflation negative, while two of the three are already pointing to a rebound in tradable inflation (i.e. the exchange rate and the oil price).
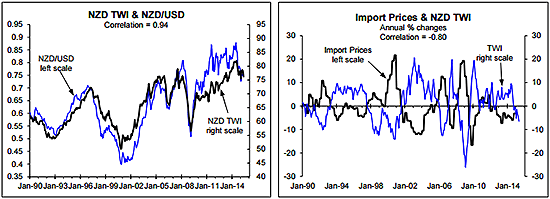
Between March 2009 and July 2014 the NZD appreciated 45% against NZ's major trading partner currencies (as measured by the TWI) and 67% against the USD (left chart below). The right chart below shows a strong negative correlation between the annual % change in the NZD TWI and the annual % change in import prices measured in NZDs (i.e. the prices that filter through to local consumer prices).
Between early-2009 and mid-2014 the appreciation in the NZD rather than global deflation drove down the NZD prices of imported goods and services, just as it made a negative contribution to the NZD prices of exported goods and services that feed into the CPI; although for export prices, international price behaviour was more important at times. If global deflation was a significant factor, import prices should have fallen more than implied by the appreciation in the NZD, but this hasn't been the case.
With the NZD TWI currently down 6% on a year ago, the right chart below points to the prospect that import price inflation should soon be moderately positive. Inflation is dead. Long live inflation. The extreme volatility in import price inflation that is largely due to the exchange rate explains much of the volatility of inflation in the tradable component of the CPI, including why it has been negative recently. But there is more to the tradable inflation than just the exchange rate and more to the overall inflation story that includes, most importantly, prospects for non-tradable inflation (see below).
The more than halving of the oil price between June 2014 and March 2015 played a part in driving tradable inflation negative, reflected in a 15% fall in the petrol price component of the CPI that made a sizeable contribution to the negative tradable inflation over the last year. But the oil price has rebounded 33% since March (left chart below). The fall in export prices last year also played a small part in the trifecta driving down tradable inflation (right chart).
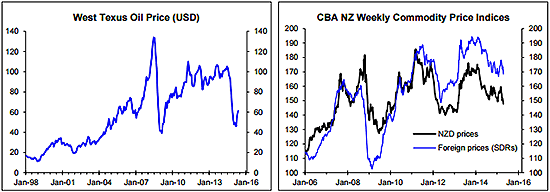
As has happened every time tradable inflation has tumbled previously, it is inevitable that it will rebound at some stage and prerequisites for it becoming at least mildly positive have already occurred (i.e. the fall in the NZD TWI and some upside in the oil price). In the case of export prices, they have taken to bouncing sideways rather than clearly heading higher or lower (right chart above), but they play a much smaller part in driving tradable inflation than do import prices, the oil price and the exchange rate.
When tradable inflation will next head back above 2% is hard to say. Who can accurately predict the exchange rate, the oil price and export prices?! But it should become sufficiently positive in the not too distant future that overall CPI inflation heads back into the governor's 1-3% medium-term target range.
I suspect the primary reason some of the bank economists are predicting OCR cuts is because they have been caught in the spotlight of the temporarily negative tradable inflation (i.e. they are excessively focused on what has occurred and have limited insight into what will happen, which isn’t unusual). And they are ignoring that the volatile cycles in tradable inflation have little bearing on the medium-term inflation prospects Governor Wheeler is supposed to focus on. Core to medium-term inflation prospects is nontradable or domestic inflation that remains above 2%.
Non-tradable inflation, migration and the labour market
Maybe non-tradable inflation is where the miracle will occur and by the time tradable inflation experiences the inevitable rebound, non-tradable inflation will have headed below 2% and possibly much lower. Recapping, the non-tradable component makes up approximately half of the goods and services in the CPI and relates to goods and services that are largely produced and consumed in New Zealand. Local demand-supply conditions are the key driver of non-tradable or domestic inflation, but one-off factors can at times have a significant temporary impact.
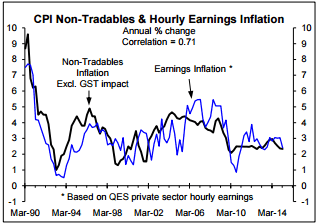
Some caution is warranted in interpreting the behaviour of hourly earnings inflation and most of the labour market indicators because they can be subject to quite a bit of random variation. For example, it is common for hourly earnings inflation to experience temporary spikes and tumbles, so I am wary of reading too much into the recent fall in hourly earnings inflation.
Labour cost inflation is central to non-tradable inflation prospects and there are some views floating around suggesting that labour cost inflation will remain low and could even head lower despite the prospect of reasonably robust economic growth: (1) the boost to labour supply from high net migration/immigration and the partly related increase in the percentage of the working age population participation in the labour force; and (2) low inflation expectations dragging down wage and salary inflation.
To meet Governor Wheeler's second precondition for OCR cuts (i.e. "wage and price-setting outcomes settle at levels lower than is consistent with the inflation target") labour cost inflation would have to head lower rather than just drift sideways. These views warrant investigation to see if they are well-founded or unsubstantiated speculation of the sort the Reserve Bank and bank economists participated in the early-1990s and early-2000s when it was also argued - incorrectly - that inflation would remain low despite robust economic growth.
There are a range of labour cost inflation measures and the one the Reserve Bank forecasts is the productivity-adjusted measure calculated by Statistics NZ (black line, chart below). Effectively it measures labour cost increases in excess of those justified by productivity growth (i.e. the purely inflation part of labour cost increases that will drive up the cost of production per unit and encourage producers to put up prices). There is a high negative correlation between the unemployment rate and adjusted labour cost inflation. The highest correlation is with the unemployment rate leading by three quarters, which is reflected in the chart by the unemployment line being advanced or shifted to the right by three quarters.
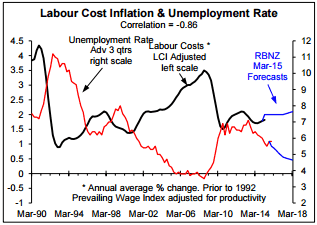
But one of the low inflation views is that high net migration is solving the skill shortage problem to the extent it will stop the unemployment rate falling further despite strong employment growth and thereby short-circuit the link between GDP growth and labour cost inflation.
Add to this the view that recent low CPI inflation will depress inflation-linked pay increases and we have the basis for suggesting labour cost inflation could fall, although the inflation-linked impact will be short-lived if CPI inflation rebounds as I expect (see pages 2-3). The migration-unemployment-low inflation view has several shortcomings.
There is no consistent relationship between the unemployment rate and net migration (left chart below).
A high proportion of immigrants coming into the country are in the 25-35 age bracket and this group has a higher than average propensity to participate in the work force. This partly explains the increase in the "participation rate" shown in the right chart below (i.e. the percentage of the working age population wanting to work).
The latest spike in the participation rate has stopped the unemployment rate from falling despite strong annual employment growth (i.e. 3.2% based on the official numbers). But the spike in the participation rate and the lack of downside in the unemployment rate recently will partly reflect random variations due to sampling errors that can have significant temporary impacts on these surveys, as is evident in the right chart below, especially in the case of the participation rate.
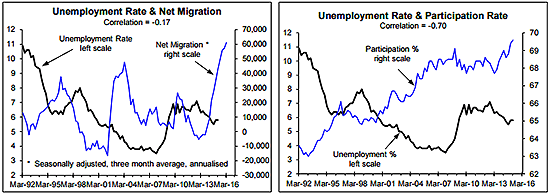
More importantly, it is normal for robust employment growth to result in the participation rate increasing and the unemployment rate falling (see the reasonably high negative correlation in the right chart above). Most of the increase in the participation rate since 2013 can be explained by normal cyclical behaviour. If employment growth remains robust, the participation rate should head higher - subject to the likelihood of random variation - and the unemployment rate should head lower.
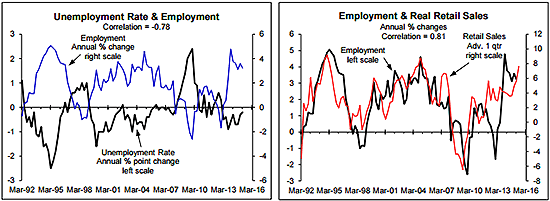
The left chart below shows the inverse relationship between annual employment growth and the annual percentage point change in the unemployment rate; with no clear breakdown in the relationship (i.e. if employment growth remains high, the unemployment rate will most likely fall further). The right chart below shows that annual growth in the volume of retail spending is a reasonably good leading indicator of annual employment growth (especially if we overlook the at times large random variation in reported employment growth).
The stronger growth in retail spending in the March quarter partly reflects a boost from Cricket World Cup spending, but the strength was much too broad-based to be attributed mainly the CWC, while it fits with the recent improvement in consumer surveys.
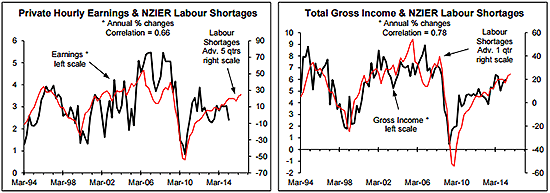
While the reported unemployment rate has stopped falling - again, this most likely partly reflects random variation in the survey - the NZIER survey of skill shortages has continued to nudge higher (red lines in the two charts below; right hand scales that show the net percentage of firms surveyed finding it harder to attract staff).
The left chart below shows the labour shortage survey to be a reasonably useful leading indicator of the private sector hourly earnings inflation that is of significant relevance to non-tradable inflation (i.e. the peak correlation of 0.66 is with the survey advanced or leading by five quarters, which is OKish but not fantastic). The right chart shows the NZIER survey as a more accurate leading indicator of annual growth in total gross income, with a more respectable correlation of 0.78, but this time the peak correlation is with it only leading by one quarter.
Unless economic growth magically slows significantly, it is hard to see how the unemployment rate won't fall further over the next year and result in skill shortages becoming more acute and a moderate labour cost inflation problem developing in 2016 and beyond. The shortcoming with the view that high net migration will solve the labour shortage problem is that the stronger population growth resulting from high net migration is a key factor driving robust growth in consumer spending that will result in stronger growth in employment and downside in the unemployment rate (i.e. net migration will end up adding at least as much to labour demand as to labour supply, which even the Reserve Bank has acknowledged). That is what the historical record shows and I can't see why things will be dramatically different this time around, although they could be a bit different at the margin.
To me the case for expecting labour cost inflation to fall and result in lower non-tradable inflation is farfetched (i.e. almost as farfetched as the Reserve Bank's labour market forecasts were in the mid-2000s as highlighted in past Ravings). Expecting robust economic growth not to result in further downside in the unemployment rate even with the aid of strong population growth is almost as farfetched, but maybe there could be an element of this. But there is one more low inflation view.
Will the fall in inflation expectations mean inflation stays low?
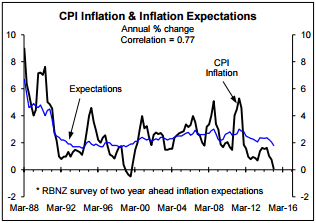
The highest correlation between CPI inflation and the survey of inflation expectations is coincidental (i.e. inflation expectations generally increase and fall at the same time inflation increases and falls). This suggests expectations reflect current inflation rather than have a bearing on future inflation. This is consistent with the findings of work I did at the Bank of England in the 1980s that showed market inflation expectations in the major countries responded to changes in historical inflation rather than offered insights into future inflation. The implication is that when tradable inflation turns positive again and drives up overall CPI inflation, inflation expectations will increase somewhat, just as occurred most recently when inflation temporarily increased in 2013.
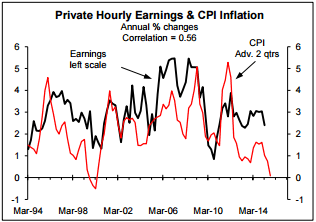
Ultimately, a tighter labour market should result in higher labour cost inflation and especially higher productivity-adjusted labour cost inflation. A key consideration at the moment that will work counter to the low inflation views is that even if labour cost inflation falls somewhat, income growth will remain well above CPI inflation for a period (i.e. real income growth of the sort relevant to growth in the volume of retail spending and growth in employment will remain strong for a while).
One angle I've not provided analysis of is growth in internet shopping and especially increased purchasing from overseas internet suppliers. I have analysed this in the past in one of our pay-to-view reports and concluded that it has been a relevant issue at times (i.e. put downward pressure on local retail prices), but when I last crunched the numbers the impact appeared to have faded. It will be of some ongoing relevance, although conceptually there should be an adjustment period over which this impacts, with much of this adjustment period potentially behind us, rather than it being a source of ongoing lower inflation.
Implications for interest rates and what borrowers should do
The analysis of inflation in this Raving has significant implications for what mortgage and corporate borrowers should do, with my views on these fronts reserved for clients of our Mortgage & Debt Strategy reports. For more info on these reports visit our website (www.sra.co.nz) or contact me (rodney@sra.co.nz). Contact Denise (denise@sra.co.nz) if you want to sign up for these reports that are being supplied on a complimentary basis to clients of our other pay-to-view reports during 2015.
These insights also have material implications for interest rate, the exchange rate and the housing market, as covered in our various pay-to-view reports. Please contact me if you want more information on any of our regular pay-to-view reports, including a sample copy.
----------------------------------------------
*Rodney Dickens is the managing director and chief research officer of Strategic Risk Analysis Limited.
12 Comments
I am not so sure on the oil rice rebounding further. OPEC is keeping its production high(er) as we get to $60 the holes in the ground that just need to be fracked to produce become viable for the desperate. Demand is also weak it seems.
In terms of CPI I really dislike having energy in it, I prefer core as its less noisey.
Then inflation itself, those trends are down or at best flat. IF inflation does actually return the RB can put up the OCR quickly, it might lose some street cred but it if says "we are dropping the OCR to help the tradeables sector but we may have to hike quickly if we get an overly strong rebound) their ass is covered.
For internet shopping effect "fading" did you include the exchange rate as a factor?
the government will keep the immigration taps fully open to cover for the cracks in the policy. without it and Christchurch rebuild slowing and commodity prices down we would already be in recession.
My thoughts exactly immigration net 56K per annum, approx 40 thousand above L-T trend adds about 1% to population and hence 1% to GDP. With multiplier above 1% as cost of household formation. I tend to be right wing but can see National are gaming the GDP figure from 1-1.5% via open gate immigration policy if not for this GDP would be approx 1.5% in the midst of the Chch rebuild and a property boom in the nation's large city. And this would not look for National as they position themselves as shrewd economic managers. They couldn't care less about GDP per capita, it's not about what is best for current citizens and all about getting re-elected.
I think some one is not in touch with the economy with their predictions even if the dairy commodities rebound the inflation rate will be flat to negative. With banks wanting to get their loan to value ratio's back in check in the farming sector 90% of farmers will have to do some major debt repayment. Then you have a unstable Auckland housing market, and a slowing Canterbury rebuild its not looking so rockstar going forward. Honestly with the rest of the world in deflation mode where do you think NZ will find Inflation.
The developed world is turning its back on dairy products and the rest of the world will follow suit eventually. Even with an expanding population, I don't see dairy as a growth industry. Just the opposite.
have you tried going dairy free?
I think you'll find that there is a huge uptake, from chocolate to plastics, energy drinks to medicines. It's just the market being gamed. For some reason European farmers got subsidies and quota caps, yet New Zealand was encouraged to produce it's heart out. One suspects that this is a secret deal at one of the "invitation only leader meets" where they divide up which country is allowed what options, and which countries are going to be trials for socio-economic theories (such as Rogerednomics) - it's also where I think our textile industry got traded away so the world cotton production would increase (with appropriately large margins) and instead we got favourable treatment on dairy, red meat and orchard produce (ie others promised not to increase development in those areas). Although nothing shows any favour for wine so that might be why it's so tempermental.
But with the FTA with China, it looks like the little country which would be annoying to try and invade will be sold off instead.
the actual uptake of dairy is increasing, but the prices are below cost of production.
Got offered $60 for a 150kgDM bale of balage. Currently using 4 a day to product 1400 liters milk every 2 days. 1400 liters/2day = 70kgMS a day. 70 * $4.50 = $300 revenue.
Electricity = $1372/month = $45/day.
Sanitiser 200l, $750; 220ml per use = 909 uses, 1 per day. 0.82c/day and alkali wash every alternate day, round up $1/day
Petrol 4wheel motorbike, following cows and around the paddock 6liter fill lasts about 6days, so 1 liter/day = $2.
$300 revenue:
$240 suppliment + $45 electricity + $1 sanitiser + $2petrol = $ 288 direct expenses
(no rent, accountant or advisors, labour, machine repair/depreciation or contibution to development).
equals $12/day GP to run the farm and as Gross Return on 2.2mil asset, 250k shares, 130 dairy cows (value around 2000 a piece).
And that $60/bale is very cheap.
It's not that dairy isn't growing, or that farmers aren't working hard. The corporation just isn't paying for what it takes, and the Commerce Commission and government are encouraging it. We told them it would happen at the TAF vote.
It's no use clutching at straws. Times change and we have to change with them.
Almost everyone I know is either dairy free or has drastically cut back on dairy products. I can't remember the last time I made a coffee or tea for anyone who wanted milk in it. Many people have reduced or eliminated their dairy intake and that's likely a growing trend as more people become health conscious. In the old days everyone gobbled down butter and cheese and other dairy but those were the old days.
You and your friends might actually be a declining minority. Dairy consumption in New Zealand is rising, not falling.
http://www.indexmundi.com/agriculture/?country=nz&commodity=milk&graph=…
Look at those numbers: The increase is slowing markedly even as the population significantly increases. The big gains were all long ago when the population was much smaller. At the current rate the increase will soon slow to a break even point with population numbers and eventually begin to go into the negative.
People in general get better educated with time and now know dairy consumption is not healthy. Like cigarettes, some will always cling to unhealthy habits like eating milk, butter, cheese and other fatty stuff but most will give it up in time. It's inevitable.
It helps to grasp this if you view the more meaningful Growth Rate chart instead of the raw Quantity graph:
http://www.indexmundi.com/agriculture/?country=nz&commodity=milk&graph=…
I think some one is not in touch with the economy with their predictions even if the dairy commodities rebound the inflation rate will be flat to negative. With banks wanting to get their loan to value ratio's back in check in the farming sector 90% of farmers will have to do some major debt repayment. Then you have a unstable Auckland housing market, and a slowing Canterbury rebuild its not looking so rockstar going forward. Honestly with the rest of the world in deflation mode where do you think NZ will find Inflation.
Keynesian government spending


We welcome your comments below. If you are not already registered, please register to comment
Remember we welcome robust, respectful and insightful debate. We don't welcome abusive or defamatory comments and will de-register those repeatedly making such comments. Our current comment policy is here.