

New debt-to-income ratio (DTI) figures released by the Reserve Bank (RBNZ) are showing clearly what the RBNZ has already said - the pending introduction of DTI restrictions by our central bank will make no difference whatsoever to people's ability to borrow - at least initially.
That's because the numbers of people borrowing on high DTIs have dropped to levels well below the proposed new limits. High interest rates are 'doing the job' of controlling high borrowing levels.
This RBNZ data series has tended to focus on DTI ratios of over five - that's people borrowing over five times their annual incomes. These are regarded as relatively high ratios and ones for the central bank to keep an eye on.
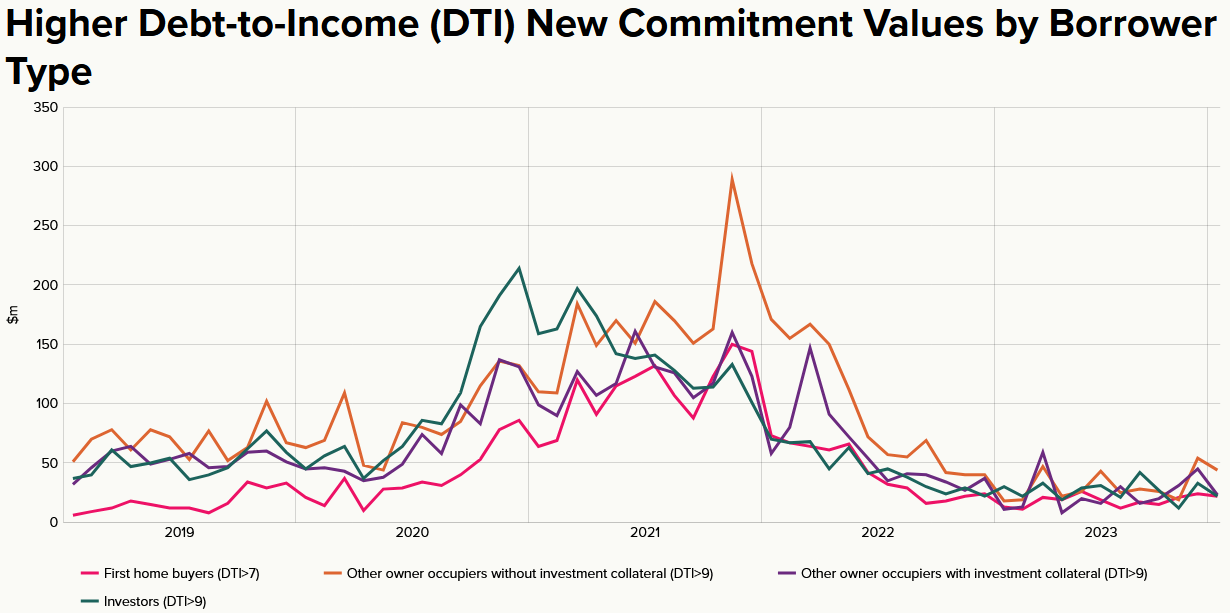
Well, as the RBNZ's summary of the latest data covering the three months to December 2023 says, in this period less than a third of new mortgage commitments had a DTI of over five, which is the lowest share since the data collection began in 2017.
Since absolutely soaring to highs in the 2020-21 period, the high DTI figures have been markedly dropping. Interestingly, though, it looks as though we've now seen the 'bottom' of the market. While the high DTI figures for the first home buyers (FHBs) have kept coming down in the latest quarter, those for other owner-occupiers and investors have just crept up a little.
So, some context.
We are now about to get official limits on how much can be borrowed at high DTIs.
As we know after a build-up not exactly bigger than Ben-Hur, but certainly even longer, the RBNZ announced last month it is consulting on proposals for DTI limits with plans to implement them around the middle of this year. The RBNZ has wanted a DTI measure in its macro-prudential toolkit since at least 2016. Now it is finally getting it, but as the RBNZ concedes itself at a time when the limits won't be 'binding'.
To refresh memories, the RBNZ proposes initially setting the DTI policy to allow banks to lend:
- 20% of their residential loans to owner-occupiers with a DTI greater than 6; and
- 20% of their residential loans to investors with a DTI greater than 7.
These percentages refer to new lending, not the total bank lending book.
They also announced they are proposing easing the loan to value ratio (LVR) settings at the same time as activating DTIs. The RBNZ proposes easing LVRs to allow:
- 20% of owner-occupier lending to borrowers with an LVR greater than 80%; and
- 5% of investor lending to borrowers with an LVR greater than 70%.
Of course, the RBNZ's intent is getting these DTI measures stashed in its 'macro-prudential toolkit' and ready to have an impact when the housing market heats again. They might not be binding now - but they will be be binding at some point, be sure of it.
To that end it is informative to have a quick look at how the proposed DTI limits, and the levels they will initially be set at, would have shaped up against borrowing trends when the market was super-hot in the 2020-21 period.
If we look at the December 2021 DTI figures, when the housing market had just gone past its peak, we can see that if the proposed DTI measures had been in place they very much WOULD have been having an impact.
Remember, the RBNZ's proposing limiting banks to just 20% of residential loans to owner-occupiers (including FHBs) with DTIs in excess of 6, while for investors (which I am assuming includes those in the category of 'owner-occupiers with investment collateral') the banks will be limited to just 20% of residential loans to investors with DTIs in excess of seven.
As per the RBNZ's data for December 2021 this shows that among FHBs over 26% had DTIs in excess of 6 at that time, while for owner-occupiers without investment collateral, over 28% had DTIs of in excess of 6.
With regard to investors, as at December 2021, 34% of owner-occupiers with investment collateral had DTIs in excess of seven, while for investors, this figure was 35.5%.
The upshot is that the proposed RBNZ DTI limits very much would have required the banks to trim back lending to all categories of borrower as of December 2021 in order to get under that 20% limit figure.
But as of now, with the much lower DTIs being seen generally, those limits will not be even close to being tested. And this is the RBNZ's intention, to introduce those limits at a time when they won't be binding, but have them available when the market heats again.
So what then of the RBNZ's latest quarterly set of DTI figures - information it has been compiling since 2017?
We've been following these from the start and compiling our own tables, looking specifically at for FHBs and other owner occupiers, borrowing at DTIs of over five, while we've been looking at investors with DTIs of over seven.
Fortuitously for us, of course the RBNZ's actually targeting DTIs of over seven for investors, but for the FHBs and other owner-occupiers the official target is going to be a DTI of over six.
Okay, for old time's sake here's an updated version of our FHB/other owner-occupier table showing the latest figures for ratios of of over five.
As we've done since the start of this data series we are comparing the latest month's figures (December 2023) with the last month from the previous release (September 2023) and we are also comparing both these with December 2022 and December 2021.
The table below shows the percentage of new mortgage money for first home buyers and other owner-occupiers that is on debt-to-income ratios of over five times:
| Group | Dec 23 | Sep 23 | Dec 22 | Dec 21 |
|---|---|---|---|---|
| FHBs nationwide | 23.9% | 29.6% | 35.2% | 58.3% |
| Auck FHBs | 34.1% | 44.1% | 49.6% | 72.9% |
| Non-Auck FHBs | 15.9% | 17.4% | 23.8% | 46.6% |
| Other owner/occ nationwide | 20.9% | 19.7% | 26.5% | 48.5% |
| Auck other owner/occ | 30.4% | 27.9% | 37.3% | 62.2% |
| Non-Auck other owner/occ | 14.0% | 13.5% | 18.6% | 38.1% |
Please note that our calculations here exclude the (small) amount where the DTI size is unknown.
Well, okay, that's DTIs of over five.
But of course, as we now know, the FHBs and other owner-occupiers are going to be controlled on the basis of DTIs of over six. The banks won't be able to lend any more than 20% of new mortgage money for owner-occupiers at DTIs over six.
So, on this basis, how are we looking based on current trends as at December 2023? Well, no sweat. No worry. If you can service the debt at all (surely the bigger worry at the moment) you can get the loan. No worry about being cut off by that 20% bank limit. Not even close.
The table below shows the percentage of new mortgage money for first home buyers and other owner-occupiers that is on debt-to-income ratios of over six times:
| Group | Dec 23 | Sep 23 | Dec 22 | Dec 21 |
|---|---|---|---|---|
| FHBs nationwide | 6.1% | 6.2% | 10.6% | 26.2% |
| Auck FHBs | 9.6% | 11.0% | 17.1% | 40.1% |
| Non-Auck FHBs | 3.3% | 2.1% | 5.3% | 15.0% |
| Other owner/occ nationwide | 7.8% | 6.2% | 9.8% | 28.2% |
| Auck other owner/occ | 11.0% | 8.3% | 14.2% | 39.7% |
| Non-Auck other owner/occ | 5.4% | 4.7% | 6.6% | 19.5% |
As you can see, even in the world of expensive taste in Auckland, things are looking fine and dandy, with the other owner occupiers on DTIs of over six making up just 11% - well below the 20% limit - as of December.
So, that's the FHBs and the owner-occupiers. Our second table that as explained above we've been running for a while - but which now takes on greater relevance given that we've accidentally picked the 'right' DTI number of seven - looks at the investor and those owner-occupiers with investment collateral with debt-to-income ratios of over SEVEN times. Again our calculations exclude the (small) amount of mortgage money where the DTI size is not known.
The next table shows the percentage of new mortgage money for both investors and owner occupiers that have investment collateral that is on debt-to-income ratios over seven times:
| Group | Dec 23 | Sep 23 | Dec 22 | Dec 21 |
|---|---|---|---|---|
| Investors nationwide | 5.9% | 7.6% | 11.7% | 35.5% |
| Auck investors | 9.5% | 10.0% | 16.4% | 45.2% |
| Non-Auck investors | 2.5% | 5.1% | 6.7% | 26.2% |
| Owner/occ + investment collateral nationwide | 8.1% | 6.0% | 8.3% | 34.0% |
| Auck owner/occ + investment collateral | 9.2% | 5.0% | 6.8% | 43.4% |
| Non-Auck owner/occ + investment collateral | 7.3% | 6.6% | 9.6% | 26.4% |
So, again, no sweat at the moment. But as you can see, looking at the far right numbers in all of the three tables - you only need to look back to December 2021 to see a time when the new DTI rules would have very much come into play.
With the apparent 'bottom' of the market now having been reached (note that some figures in the December columns are higher than those for September 2023) it will be interesting to see what happens in coming months as we do get toward introduction of the new limits.
We welcome your comments below. If you are not already registered, please register to comment
Remember we welcome robust, respectful and insightful debate. We don't welcome abusive or defamatory comments and will de-register those repeatedly making such comments. Our current comment policy is here.