
Inflation has risen to 7.3% for the year to June, which is the highest level in 32 years.
And it's also higher than the Reserve Bank and economists were forecasting. As of March inflation had been 6.9%.
The latest figures make it a racing certainty that the RBNZ will hike the Official Cash Rate again by 50 points at its next review on August 17 and will very much firm up expectations that another 50 pointer will follow in October. If that were to be the case it would see the OCR at 3.5% well before the end of the year.
Monday's inflation figures probably dash the hopes of some that mortgage rates may have peaked.
Crucially also, the non-tradeables inflation - domestically generated inflation - was 6.3%, the highest since the series began in 2000 and up from 6.0% in March - and much higher than the 6.0% economists were expecting and the 5.7% the RBNZ was expecting.
What it means is that locally generated inflation is running much hotter than people even thought.
ASB senior economist Mark Smith said the record high annual non-tradable inflation "will be of concern to the RBNZ".
"We think annual CPI inflation has likely peaked, but this is still uncertain. Unless labour market pressures concertedly ease, current high inflation outcomes run the risk of being increasingly entrenched.
"Restrictive OCR settings are required, and we expect a 50bp hike in August and a 3.5% late 2022 OCR peak. OCR cuts beyond then will depend crucially on the labour market and external inflation environment cooling," Smith said.
Statistics New Zealand said the main driver for the 7.3% annual inflation to the June 2022 quarter was the housing and household utilities group, due to rising prices for construction and rentals for housing.
Prices for the construction of new dwellings increased 18% in the June 2022 quarter compared with the June 2021 quarter.
"Supply-chain issues, labour costs, and higher demand have continued to push up the cost of building a new house," Stats NZ general manager Jason Attewell said.
"The 18% annual increase in the June quarter follows an 18% increase in March and a 16% increase in December 2021."
It takes inflation to levels last seen in 1990. The June quarter rise was 1.7%.
Economists had forecast an annual rate in the 7.0% to 7.2% range, while the Reserve Bank had forecast 7.0%, with this to be the peak.
The tradeable inflation rate, which measures goods and services that are influenced by foreign markets, was 8.7% in the year to the June 2022 quarter – the largest annual movement, either up or down, since the series began in June 2000.
The RBNZ is charged with keeping inflation in a 1% to 3%, but it is not forecasting to be able to get inflation back under 3% till late next year. Economists doubt whether it will be able to achieve it even in that timeframe.
The central bank has made killing inflation - and perhaps more pertinently, killing expectations of future inflation - its absolute priority and it has recently hiked the Official Cash Rate to 2.5% with 50 point rises in each of its last three reviews. Another 50 point rise is widely expected at the next review in August.
The RBNZ has forecast the OCR to peak at just under 4% in the middle of next year. Wholesale interest rate market pricing is suggesting the markets currently expect the OCR to go slightly above 4%.
The Government made a pre-emptive strike to fight off criticism on Sunday when it extended the 25c a litre fuel tax cut and half price public transport fares to the end of January 2023.
Inflation has risen rapidly. In March last year the annual rate was just 1.5%. A year ago the RBNZ was forecasting that inflation would be just 1.5% in the June quarter of 2022.
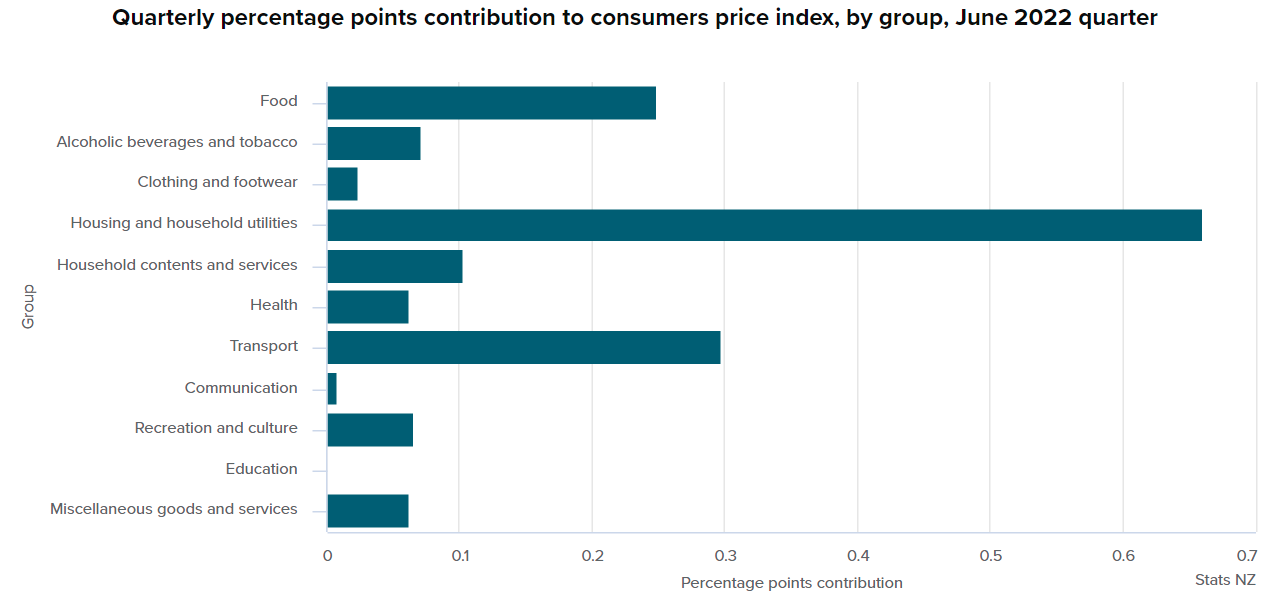
In terms of the 1.7% quarterly increase, Stats NZ said main contributors were:
- Housing and household utilities rose 2.3%, influenced by home ownership (up 4.5%) and actual rentals for housing (up 1.2%).
- Transport rose 2.3%, influenced by private transport supplies and services (up 5.5%) and partly offset by a fall in passenger transport services (down 9.0%).
- Food rose 1.3%, influenced by restaurant meals and ready-to-eat food (up 2.6%) and grocery food (up 1.9%).
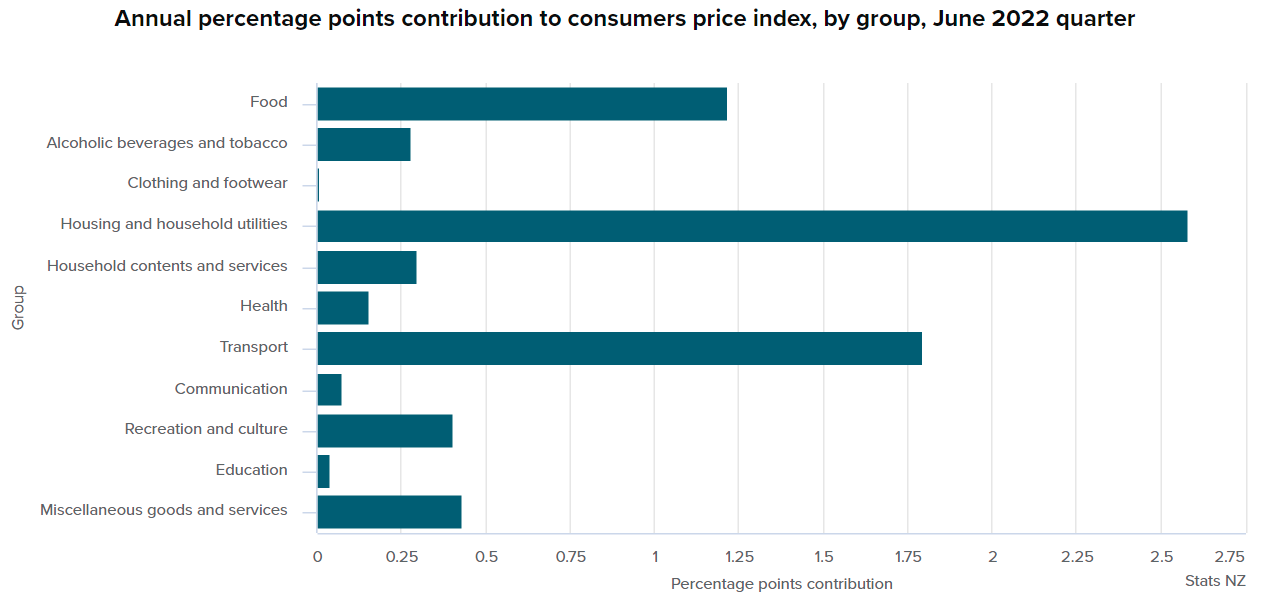
In terms of the main annual changes, these were:
- Housing and household utilities increased 9.1%, influenced by home ownership (up 18%) and actual rentals for housing (up 4.3%).
- Transport increased 14%, influenced by private transport supplies and services (up 25%) and purchase of vehicles (up 4.0%).
- Food increased 6.5%, influenced by grocery food (up 7.1%) and restaurant meals and ready-to-eat food (up 5.8%).
- Miscellaneous goods and services increased 5.5% influenced by other miscellaneous services (up 11%) and personal care (up 7.3%).
We welcome your comments below. If you are not already registered, please register to comment
Remember we welcome robust, respectful and insightful debate. We don't welcome abusive or defamatory comments and will de-register those repeatedly making such comments. Our current comment policy is here.