

According to President Trump, his henchman and Kevin Warsh at the US Federal Reserve, the US economy is growing robustly. They all say the reason for the dramatic increase in US Treasury Bond yields to well above 5.00% is because the economy is so strong and demand for capital is driving the price of money higher.
That is certainly the case for the construction of data centres for the AI boom space, however it is very much a lop-sided and narrow area of growth in the US economy currently.
The hedge fund speculators who are leveraging into massive, short-sold bond positions believe that rhetoric. These punters will continue to believe the narrative until the day comes when they decide to take their profits and buy back the short-sold bond bets.
Most global, long-term fixed interest investors would support the alternative view that the reason bond yields have increased (bond prices decreased) is that they do not see the Trump regime reining-in their fiscal deficit and controlling the supply of new bonds being issued to fund that annual cash shortfall. US bond supply is exceeding demand, hence lower bond prices and higher yields.
What global investors are saying is that they want additional compensation (high yield returns) for the risk of owning US Treasury Bonds.
Trump and Warsh also claim that strong US economic growth will solve the fiscal deficit problem with higher tax revenue inflows. The US Government is projected to receive US$5.40 trillion in tax revenue in 2026, about US$160 billion more than the US$5.26 trillion received in 2025.
When the Federal fiscal deficit for the 31 December 2026 financial year is projected to be US$2 trillion, the tax revenue increase is miniscule in comparison. Their claims do not stack up to scrutiny!
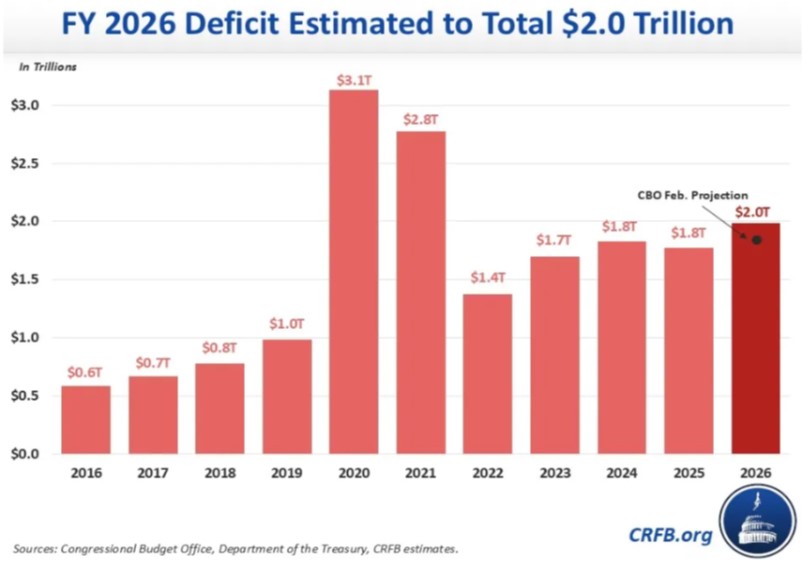
The increase in US secondary market bond yields also keeps adding to the Federal Government’s annual US$1.1 trillion interest bill, as they issue new bonds at the higher market interest rates. It is a death spiral that no sovereign bond issuer wants to be in.
The more accurate narrative on the current performance of the US economy is that the “low fire/low hire” labour market is resulting in lower wages growth and pressured household budgets as gasoline prices increase in response to a war that Trump started and does not know how to finish.
Following the September Non-Farm Payrolls jobs data and accompanying wages data last Friday, the financial markets are rapidly reassessing their pricing of expecting another Fed interest rate hike this month. Many Fed members continue to erroneously describe the US labour market as “robust” and coupled with inflation remaining above 2.00% for too long, they voted for interest rate hikes.
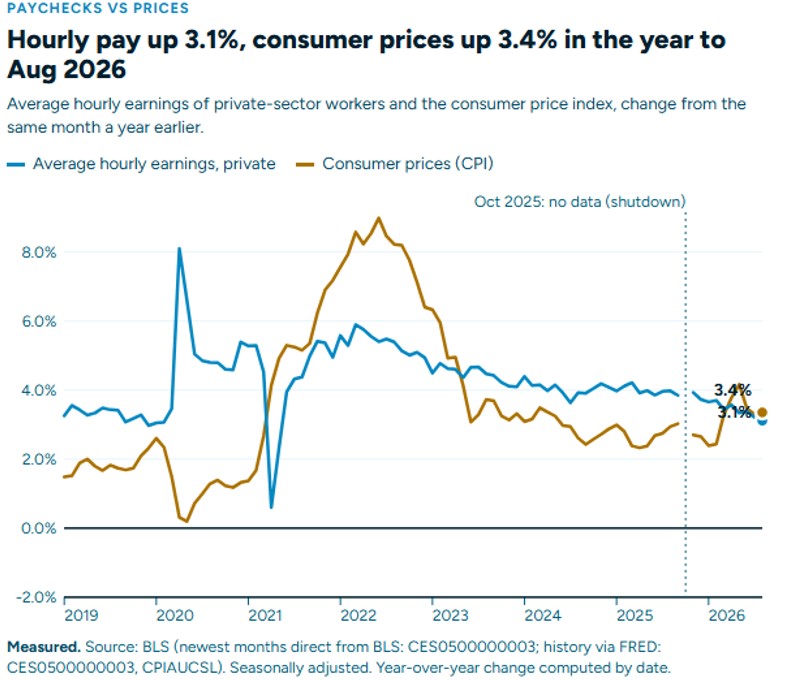
Yet again, the September increase in jobs of 29,000 was much weaker than forecast (+90,000) and yet again, previous months increases were revised down by 60,000 jobs. However, the more telling commentary on the state of the US labour market is the lack of bargaining power from workers to demand higher wages and the unwillingness of business firms to deliver wage increases. The labour market is finely balanced between demand and supply, leaving households with annual wage increase now below the rate of inflation.
US average hourly earnings (wages) increased 0.10% in September (below consensus of +0.20%), bringing the annual hourly earnings increase to 3.00%, which is below the CPI inflation rate of 3.40%. The decline in wages growth is deflationary, so why would the Fed want to hike interest rates at this time to reduce consumer demand?
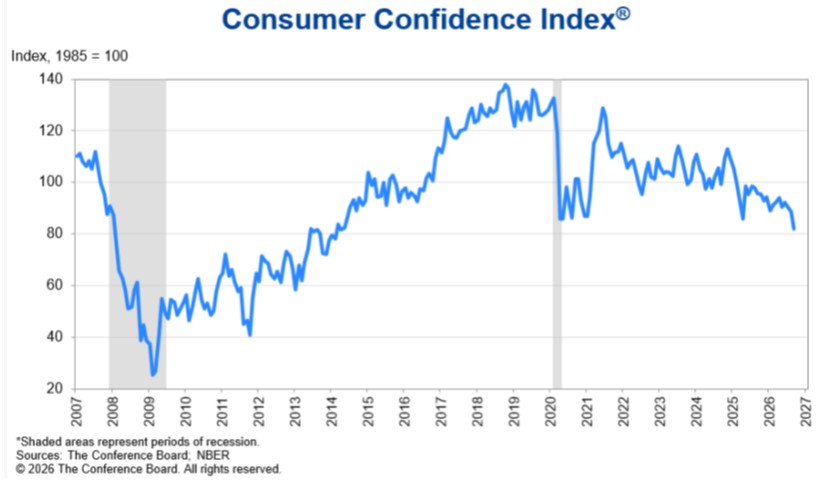
Consumer confidence in the US has plummeted over recent months as the CB Consumer Confidence survey result for September confirmed last week. The confidence index dropping to 81.9, well below prior consensus forecasts of 89.0 (second chart below). Just like Trump and Warsh, the economic forecasters in the US are also badly misreading the underlying consumer/household demand in the economy.
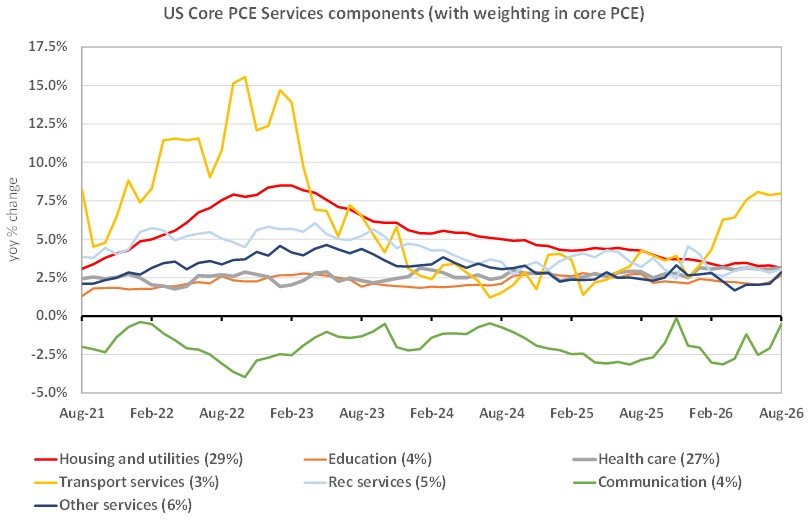
The final piece of economic evidence to support the argument that the Fed should abandon their tightening of monetary policy by increasing interest rates further, is the PCE inflation result for August. The prior market forecasts were for the annual rate of core PCE inflation to increase from 3.00% to 3.40%. The actual results was an unchanged annual rate of 3.00%. The July increase was revised downwards.
Breaking down the annual rate of core services inflation into its component parts reveals little evidence of prices increasing or being at risk to future increases. As wage costs are the largest component of services inflation in the US, there is nothing pushing inflation higher. In the chart below “transport services” is the only price that has increased as it includes airfares which are up on much higher jet fuel prices.
Our conclusion from the above analysis is that the US short-term interest rate market (two-year Treasury bond yields) has overreacted in an extreme manner to the messaging from the Fed that interest rates need to be pushed higher to push inflation down the 2.00% Fed target. The two-year bond yield has increased from 4.14% to 4.82% over the last six weeks since mid-August, the markets worried about inflation because the Fed are worried about it. The market is pricing in another three or four more 0.25% increases in the Fed Funds interest rate (currently 3.90% mid-point). The extreme forward pricing is not going to happen and therefore it will inevitably unwind by the two-year bond yield reverting back closer to 4.00%.
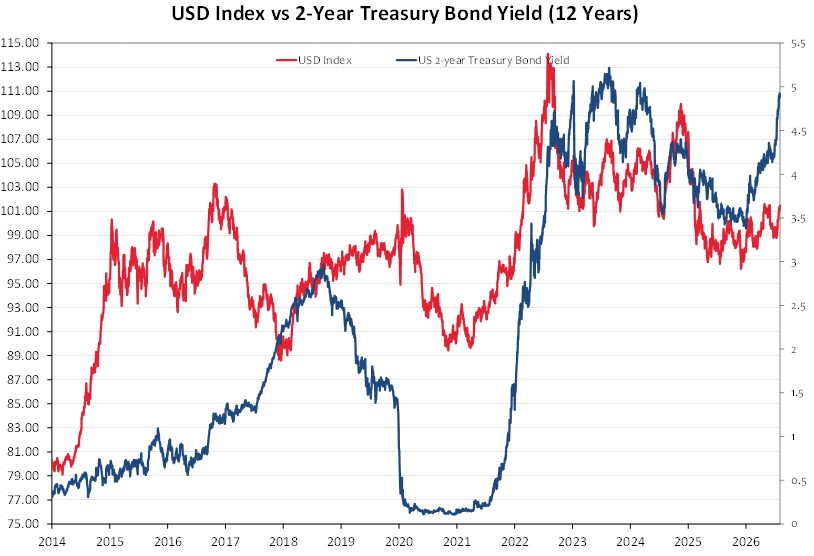
The USD Dixy Currency Index broadly follows US short-term interest rate (refer to the chart below). The USD has appreciated from 98.20 in early September to 101.70 today on the back of the interest rate increases. The two-year bond yield reversed downwards from levels around 5.00% on three separate occasions in 2023, 2024 and 2025. It looks set to do so again as the extreme pricing is not warranted on any inflation-based reasoning. The prospect of further USD gains seems limited from here, whereas a re-rating in the short-term interest rate markets would drive a lower USD value.
Kiwi dollar caught in the backwash of USD appreciation
A local bank economist claimed in the media last week that the reason why the NZ dollar had depreciated so sharply to 0.5600 was that the New Zealand economy was weak and this was being reflected in the exchange rate. Nothing could be further from the truth. The New Zealand economy expanded by 2.60% over the 12 months to 30 June 2026, above the +2.10% GDP growth levels in both the US and Australia. Never let the facts get in the way of a good line!
There are two reasons why the NZD/USD exchange rate has plunged from 0.5975 on 25th August to a low of 0.5585 on 1st October: -
- The Reserve Bank of New Zealand decided in early September to “take a cup of tea” in pausing the previously planned OCR increase in October. That ill-conceived decision was not what the financial markets were expecting and caused doubt as to the RBNZ’s commitment to get inflation under control. The Kiwi dollar was sold down aggressively to 0.5800 as a result. As commented on previously, the RBNZ should have known that the NZ dollar would be sold when they decided to go slow on interest rate increases, precisely at the time the US and Australia were increasing their interest rates to tighten monetary policy. They now have an even greater problem (mostly of their own making) with tradable inflation increasing above their forecasts with the currency depreciation.
- As outlined above, the USD itself started to strengthen from mid-September from 98.60 at the time to 101.70 today. The USD appreciation on the back of sharply rising US short-term and long-term interest rates, sending the NZD/USD down two cents from 0.5800 to 0.5600 over recent weeks. The Kiwi dollar has been caught in the backwash of that USD appreciation against all the major currencies.
Whether the NZD/USD can once again reverse out of the latest plummet to 0.5600 depends on the whether the two influences listed above can reverse their direction.
The local interest rate market is now pricing a 60% probability that the RBNZ will be forced to abandon their signalled pause and implement a 0.25% OCR increase on 28th October to 3.00%. The RBNZ will have eat a bit of humble pie in backtracking on their early September statement. The FX markets should also start to price-in in advance a RBNZ U-turn on the October rate hike and therefore some NZD/USD recovery has to be expected.
The latest inflation and jobs data in the US (as discussed above) has moved the markets away from expecting another Federal Reserve interest rate hike this month. Whether there will still be an interest rate increase from the Fed in December remains to be seen. If oil prices reduce further from their current US$91.20 level (WTI), the Fed worries about second round inflation impacts from oil price increases will be alleviated. We expect the US dollar to reverse back from its recent highs as the US short-term interest rate markets start to unwind their higher pricing on the softer than anticipated US economic data. CPI inflation data for September is the next significant economic release on 14th October. Here in New Zealand, we have the NZIER quarterly survey of business confidence this Tuesday 6th October and then the CPI inflation results for the September quarter on 22nd October.
Ther is no sign that the sell-down in the Kiwi dollar over recent weeks is being cause by concerns over political risk with the upcoming general election. Certainly, a return of a centre-right National coalition government to power would be seen by offshore currency players as a positive for the Kiwi dollar. In the less likely event (in the author’s considered opinion!) of a centre-left Government gaining power, the Kiwi dollar would be under more downward pressure as higher taxes, higher deficits and higher Government debt erode confidence and investment. The current political opinion polls indicate a very close result that could go either way. General elections in New Zealand are won and lost in the largest city of Auckland. The polls are close as many parts of Auckland have yet to see improving economic conditions and personal financial positions from the export-led economic growth that has boosted the rest of the country. Auckland house prices remain under downward pressure and sadly, that is how many folk judge the performance of the economy.
If the National Party want to lead a centre-right coalition government again they need to find a way to better communicate to the wider masses the strong turnaround in the economy and what that means for the average household. Unfortunately, the vast majority of the public have no idea what “fiscal deficit”, “GDP growth”, “Debt to GDP ratio” or “tax bracket creep” mean or how those economic measure affect their daily lives. One very effective method of communicating often complicated economic/financial information is by using visual aids – “a picture is worth a thousand words”. Sir Roger Douglas used large charts of economic trends in his election campaign when he started the ACT Party in the 1990’s. The National Party, to give themselves a chance, should adopt the same communication strategy over coming weeks.
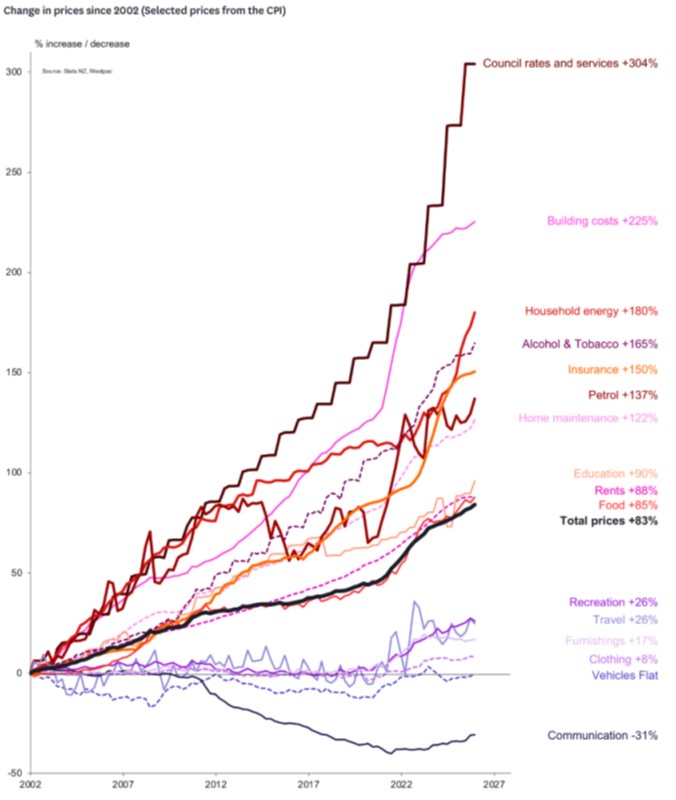
One very good example of utilising charts to convey a powerful economic message is the chart below on New Zealand inflation components from Westpac. Even your average Joe and Jane in the suburbs will understand why the Government is enforcing local government amalgamations, as council rates increases are out of control and have been for more than 20 years. The chart could be divided into two, between massive price increase in uncompetitive sectors and much lower price increases in competitive parts of the economy.
Daily exchange rates
Select chart tabs
*Roger J Kerr is Executive Chairman of Barrington Treasury Services NZ Limited. He has written commentaries on the NZ dollar since 1981.
We welcome your comments below. If you are not already registered, please register to comment
Remember we welcome robust, respectful and insightful debate. We don't welcome abusive or defamatory comments and will de-register those repeatedly making such comments. Our current comment policy is here.