
Summary of key points:
- Factors behind the NZ dollar sell-off to below 0.5600 are already reversing
- “Key reversal day” in US Treasury Bond yields
- Luck runs out for the “lucky country”
Picking “tipping points” or “turning points” in advance in financial markets is nigh impossible. A strong conviction or just a hunch based in well analysed evidence is really nothing more than guesswork. However, there are times when pricing in markets becomes so extended in one direction that a crunch point does not seem far way for the sentiment to turn the other way. There are times when the speculative positioning in futures markets becomes so overweight one-way, that you just know that it will not take much to reverse the price direction, triggering all the stop-loss orders and stop-profit orders in doing so. Market direction and sentiment can turn the other way very quickly if the reasons and rationale for the original movement are unexpectedly and suddenly undermined by new events or announcements. Global shocks (wars, revolutions, earthquakes, pandemics, tariffs, cybercrime etc), political upheavals, central bank decisions economic forecast misses are all risk events that can turn the markets on their head. Most of these events are not anticipated in advance and therefore they have the potential to cause massive market reversals if the pricing is overextended in one direction in the first place.
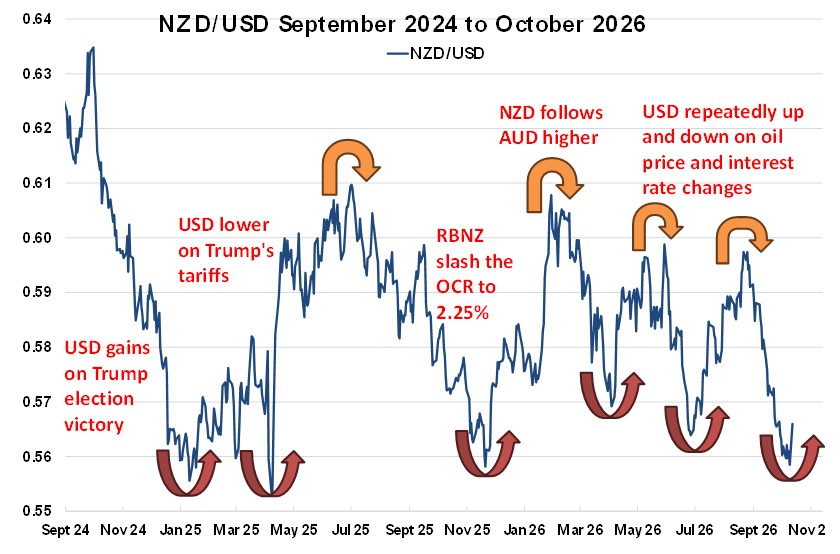
The Kiwi dollar exchange rate against the US dollar over the last 24 months has experienced a number of these sharp reversals in direction, the majority of which have not been anticipated in advance. Off course, it is very easy to explain how and why the price reversal occurred with the benefit of hindsight. However, what is useful and possible, is to identify the extended market conditions that make pricing susceptible to a sudden and dramatic reversal. Picking when markets are considered over-bought or over-sold involves an assessment of how and when have all the positive or negative factors have been fully priced-in to the market. In the example of the Kiwi dollar, the selling forces that depreciate the NZD/USD exchange rate from 0.6000 to 0.5600 seemingly lose their intensity and commitment when rates below 0.5600 are achieved. The greater likelihood becomes an NZD recovery back upwards as all the market participants who sold the Kiwi dollar at higher levels become more interested in closing-down their short-sold positions i.e. buying the NZD to take their FX profits.
The latest sell off in the NZ dollar from 0.5950 in late August to a low of 0.5585 on 12th October was initially caused by the RBNZ signalling a “go slow” on OCR interest rate increases by skipping the planned October 0.25% hike, followed by US dollar appreciation against all currencies over the last five weeks due to US market interest rate increases. The economic evidence and market price-action evidence are both starting to gather to suggest that the Kiwi dollar is already reversing its engines back upwards. The original RBNZ and USD related negative factors for the Kiwi dollar may have run their course. The risk now being that they both reverse in the opposite direction.
Firstly, RBNZ Chief Economic, Paul Conway intimated last week that the RBNZ was pleased that the interest rate markets were sitting on the fence with a 60% probability that the RBNZ will hike the OCR by 0.25% on 28th October. Their plan was to have “optionality” on the decision to hike or not in October, depending on the evolving economic data. Just why you would want such optionality to adjust speed when you are deliberately shifting monetary policy conditions from super loose (2.25% OCR) to somewhere near neutral (3.50% to 4.00% OCR) is difficult to understand. It is not as if local and global economic/market conditions are suddenly going to change to allow New Zealand’s inflation rate to decrease at a faster rate than the RBNZ are currently forecasting. To the contrary, the risks have shifted the other way with oil prices higher and the NZ dollar lower than what the RBNZ were assuming in the last forecasts. The odds have shifted to the RBNZ being forced to U-turn on their 2 September signal of likely skipping an October OCR rate hike.
Secondly, the overall value of the US dollar, as measured by the USD Dixy Index, has reversed downwards from a high of 102.60 on 14th October to 101.59 at the close on Friday 16th October. The US dollar has depreciated over the last three trading days despite significantly higher oil prices; a US CPI inflation results for September above forecasts and US retail sales figures also above expectations – all developments normally positive for the USD. The surprising US dollar weakness allowing the NZD/USD exchange rate to crawl off the floor at 0.5585 and recover to 0.5660.
The latest sentiment in global FX markets to sell the US dollar lower has followed a potential “turning point” in the direction of US Treasury Bond yields (discussed in the next section).
Whether the Kiwi dollar can ultimately break out of the 0.6100 to 0.5600 shackle it has remained within over the last two years, really comes down to how the US dollar responds to the following lead determinants over coming months: -
- Oil price movements.
- US inflation trends (outside of oil price changes)
- How and when the AI equities/debt bubble bursts.
- US interest rate direction in reaction to the three above determinants.
The five previous spikes lower in the NZD/USD rate over the last two years have all resulted in immediate reversals, the current sell-off looks set to do the same.
”Key reversal day” in US Treasury Bond yields
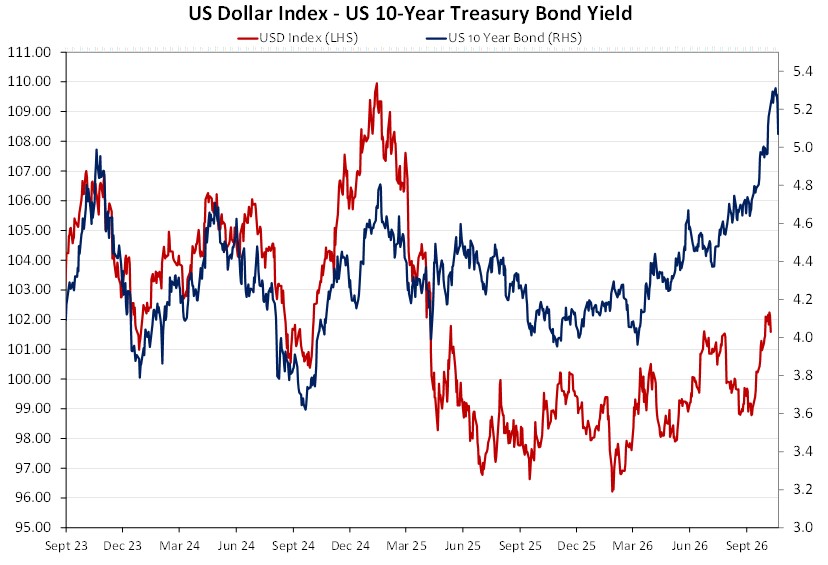
A “key reversal day” in financial markets is a “single-session technical chart pattern that signals a potential change in the direction of an existing trend”. US 10-year Treasury Bond yields hit a high of 5.35% on 15th October, up from an open of 5.19%, following hotter than expected US CPI inflation data for September. However, the selling of bonds that was pushing the yields higher immediately reversed on the same day, to close the day at 5.04%.
The price action in the 10-year Treasury Bond market on the 15th October fulfilled the criteria for a “bearish key reversal”, being: -
- Occurred during an uptrend – Yes.
- Pushed to a new high above the previous day’s peak – Yes.
- The momentum fails intra-day, and the bond yield decreased sharply – Yes.
- The yield closed below the previous day’s open, low and close – Yes.
As the chart below confirms, the spike higher in US bond yields has come to a shuddering halt. The buyers of bonds seem to come from two sources; genuine long-term investors who are enticed by the record high real yield returns above inflation and the hedge fund guys, who have been running large and leveraged short-sold bond positions, suddenly getting cold feet about continuing increases in yields and decided to take their profits. Bond yields are likely to continue to reverse back down as investors take refuge from a brewing blow-up in the AI equities and debt markets. The yields on data centre company, Coreweave's US$50 billion of debt soared to 15% this week and their share price dropped 15% over the week. Doubts are creeping into the market as to whether the heavy debt-funded data centre build outs will generate sufficient revenue to match the upfront costs.
The sharp reversal in bond yields caused the USD to lose ground against the major currencies. A slowing down in the data centre infrastructure build due to financial collapses would take some of the heat out inflation increases in the US coming from this source. The markets are not expecting the Federal reserve to increase interest rates again at their meeting on Wednesday 28th October (Thursday morning NZT). It would be a surprise and would strengthen the US dollar if Chair Warsh convinced his fellow members to hike again.
If we do now witness a major correction downwards in US equity markets as the AI stock valuation bubble bursts, it is tricky to gauge what the impact on the value of the NZ dollar will be. Tumbling share markets and investor “risk-off” sentiment is always a negative for the Kiwi dollar. However, foreign investors exiting the US markets would be sellers of the US dollar (a positive for the NZD).
Luck runs out for the “lucky country”
It may only be one single piece of economic data (that is notoriously volatile month to month), however last Thursday’s Australian employment change figures that recorded a 39,300 decrease in jobs for the month of September was taken as symptomatic of a rapidly slowing economy. The unemployment rate increased from 4.60% to 4.70%, and it does appear that Reserve Bank of Australia (“RBA”) Governor Michele Bullock is quite rapidly getting the economic responses she wants with higher interest rates to bring down inflation. It was the former Australian Prime Minister and Treasurer, Paul Keating who coined the phrase in 1990 on an Australian economic downturn “the recession we have to have”. Paul Keating’s view was that the painful contraction was a necessary correction to break Australia’s boom/bust cycle, curb inflation and force the economy to mature. Outside of a brief recession with Covid in 2020, Australia has not experienced an economic recession since 1990. The Australian dollar recoiled downwards on the weak employment data as it provides further evidence of economic activity cooling off. The AUD/USD exchange rate dropped from 0.6980 to a low of 0.6900 on the day. The Aussie dollar has recovered a little since to 0.6950 with the weaker USD on global markets on Friday 16th October. The independent AUD selling allowed the NZD/AUD cross-rate to post its first meaningful gains in a number of weeks, lifting from 0.8020 to 0.8140.
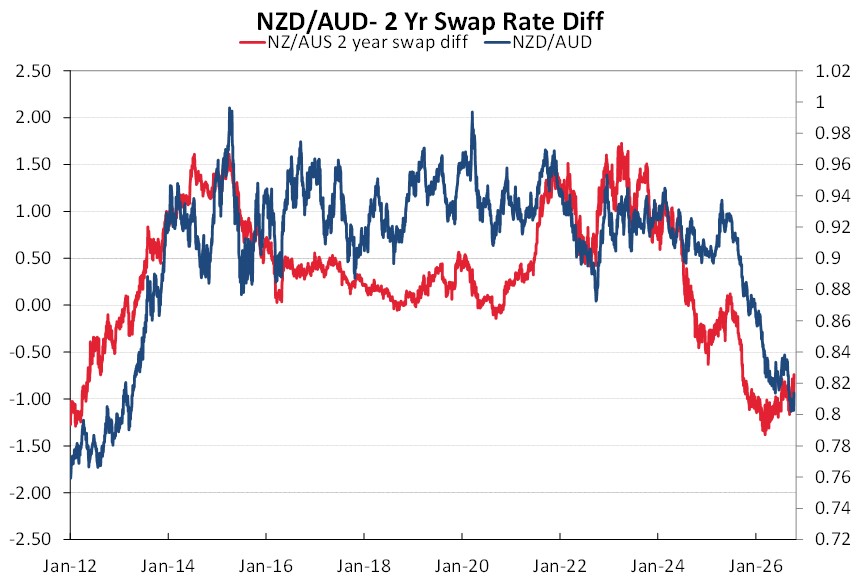
Looking ahead, the NZD/AUD cross-rate is likely to make substantial further gains as the RBNZ increase the OCR interest rate from 2.75% to somewhere near 3.75% over coming months, whereas the RBA are rapidly coming to the end of their monetary tightening cycle and could well be cutting their OCR interest rates by mid-2027 on a contracting economy. Monetary policy settings between Australia and New Zealand were completely out of synch with each other 12 months ago when New Zealand were cutting the OCR to 2.25% and the Aussies hiked rates in early 2026. That disparity caused the NZD/AUD cross-rate to plunge from 0.9000 to 0.8000 as funds shifted out of the lower yielding NZD currency to the higher yielding AUD currency. Over coming months, we will see the exact opposite to those events, with the RBNZ raising interest rates and the Australian interest rate markets commencing to price-in RBA cuts in 2027. The current gap between Australia’s and New Zealand’s two-year swap interest rates is 0.74% (NZ 4.07%, Australia 4.81%). The Australian two-year rate is destined to reduce over coming weeks/months as the forward market pricing switches from pricing RBA OCR hikes to pricing cuts. The New Zealand two-year swap interest rate will be stable to higher as the RBNZ hike interest rates to return monetary settings to neutral. It is not inconceivable that by early 2027 the differential/gap in the respective two-year interest rates will be zero (0.00%), with both two-year interest rates around 4.20%.
The chart below confirms the close correlation between the NZD/AUD cross-rate (blue line) and the two-year interest rate differential (red line). The interest rate differential has already closed up from 1.25% to 0.74% over the course of recent months. As is continues to close to 0.00%, there is a real prospect that the NZD/USD exchange rate outperforms the AUD/USD rate, and the NZD/AUD cross-rate climbs back to the 0.8700 area.
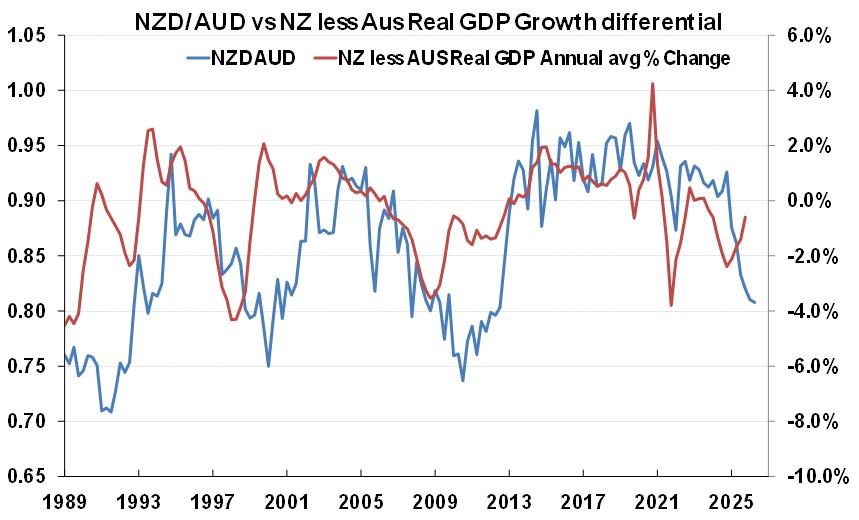
The second chart plots the difference between annual GDP growth rates in New Zealand and Australia (red line) against the NZD/AUD cross-rate (blue line). Looking into 2027, New Zealand GDP growth is forecast to be close to +3.00%, whereas the slowing Australian economy will be slowing to a GDP growth rate close to +1.50% (or even lower). Comparative economic performance does drive the NZD/AUD exchange rate as changing interest rates reflect the economic conditions in both countries. The growth differential moving up to positive for NZ over Australia also points to a much higher NZD/AUD cross-rate.
Daily exchange rates
Select chart tabs
*Roger J Kerr is Executive Chairman of Barrington Treasury Services NZ Limited. He has written commentaries on the NZ dollar since 1981.
We welcome your comments below. If you are not already registered, please register to comment
Remember we welcome robust, respectful and insightful debate. We don't welcome abusive or defamatory comments and will de-register those repeatedly making such comments. Our current comment policy is here.