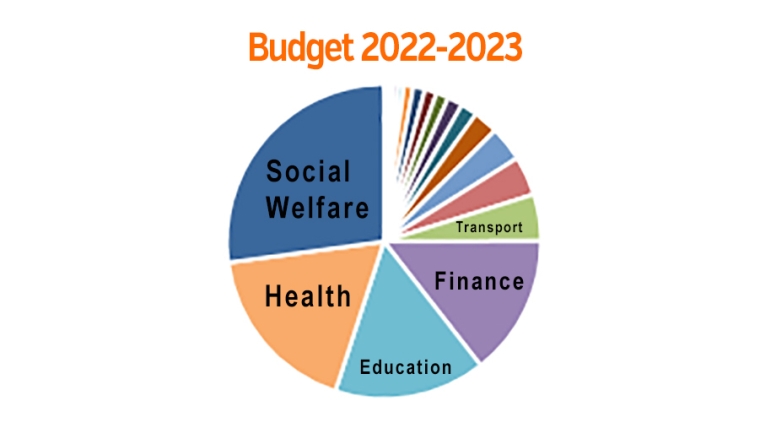
This table outlines the New Zealand Government's planned spending for the 2022/23 budget year.
Actual spending for the previous four years is on the left.
The numbers are drawn together from data released by the Minister of Finance on May 19, 2022.
Links to the primary sources used, from Treasury's website, can be found at the bottom of the page.
Click on any heading to drill down to what makes up these numbers. (Coming soon) Figures for each allocation are in millions of NZ$.
| Actual 2017/18 | Actual 2018/19 | Actual 2019/20 | Actual 2020/21 | Estimate 2021/22 | Budget 2022/23 | % | |
| NZ$m | NZ$m | NZ$m | NZ$m | NZ$m | NZ$m | ||
| 705.1 | 779.4 | 814.4 | 0.0 | 0.0 | Official Development Assistance (Old) | 0.0 | 0.0% |
| 2.2 | 16.1 | 17.7 | 10.6 | 7.4 | Pike River Re-entry | 0.0 | 0.0% |
| 2,257.1 | 722.0 | 0.0 | 0.0 | 0.0 | Social Housing (Old) | 0.0 | 0.0% |
| 3.3 | 3.6 | 3.7 | 3.5 | 4.8 | Commissioner for Environment | 4.5 | 0.0% |
| 5.2 | 5.8 | 6.4 | 8.6 | 13.5 | Women | 13.0 | 0.0% |
| 10.9 | 10.4 | 9.8 | 12.3 | 15.7 | Serious Fraud | 16.8 | 0.0% |
| 22.0 | 21.8 | 21.2 | 22.0 | 26.2 | Office of the Clerk | 26.0 | 0.0% |
| 20.5 | 20.1 | 20.5 | 19.0 | 24.7 | Parliamentary Counsel | 27.2 | 0.0% |
| 32.0 | 29.8 | 32.9 | 35.6 | 37.3 | Education Review Office | 38.8 | 0.0% |
| 47.2 | 46.0 | 46.1 | 47.3 | 55.2 | Public Service | 48.4 | 0.0% |
| 17.3 | 18.2 | 23.5 | 27.1 | 43.1 | Ombudsmen | 54.3 | 0.0% |
| 9.6 | 11.8 | 20.0 | 49.1 | 68.2 | Pacific Peoples | 76.6 | 0.1% |
| 66.8 | 74.2 | 90.0 | 95.2 | 89.8 | Security Intelligence | 108.7 | 0.1% |
| 68.5 | 68.8 | 73.3 | 79.3 | 84.2 | Attorney-General | 129.6 | 0.1% |
| 94.7 | 94.5 | 101.4 | 113.8 | 124.2 | Audit | 129.8 | 0.1% |
| 0.0 | 28.7 | 66.7 | 71.3 | 119.9 | Forestry | 146.6 | 0.1% |
| 90.0 | 106.0 | 124.0 | 112.5 | 210.0 | Prime Minister and Cabinet | 147.2 | 0.1% |
| 89.2 | 89.3 | 97.5 | 212.9 | 146.8 | Sport and Recreation | 159.4 | 0.1% |
| 152.1 | 150.0 | 167.1 | 177.5 | 221.1 | Parliamentary Service | 212.9 | 0.1% |
| 103.1 | 129.7 | 137.0 | 161.5 | 184.9 | Comms Security & Intelligence | 234.5 | 0.2% |
| 202.3 | 160.0 | 158.2 | 189.0 | 273.4 | Statistics | 319.8 | 0.2% |
| 240.7 | 183.6 | 225.6 | 221.4 | 409.1 | Lands | 333.7 | 0.2% |
| 214.1 | 229.4 | 246.2 | 261.6 | 332.7 | Customs | 336.2 | 0.2% |
| 304.3 | 98.9 | 62.1 | 405.5 | 472.3 | Te Arawhiti | 420.3 | 0.3% |
| 336.8 | 278.2 | 112.6 | 763.0 | 793.2 | Building and Construction | 424.1 | 0.3% |
| 306.9 | 336.1 | 432.3 | 496.4 | 737.5 | Māori Development | 563.6 | 0.4% |
| 284.0 | 329.3 | 385.5 | 518.5 | 666.6 | Arts, Culture and Heritage | 640.7 | 0.4% |
| 475.5 | 483.2 | 564.0 | 665.4 | 614.7 | Justice | 731.4 | 0.5% |
| 591.1 | 618.6 | 656.0 | 719.6 | 784.1 | Courts | 835.2 | 0.6% |
| 413.7 | 457.2 | 532.4 | 631.0 | 715.3 | Conservation | 840.7 | 0.6% |
| 687.3 | 684.3 | 758.0 | 1,111.4 | 1,223.0 | Internal Affairs | 879.7 | 0.6% |
| 791.8 | 848.7 | 787.7 | 812.9 | 966.8 | Ag, Biosecurity, Fish & Food Safety | 1,010.1 | 0.7% |
| 253.3 | 434.6 | 297.9 | 536.9 | 873.1 | Defence | 1,178.0 | 0.8% |
| 863.8 | 980.0 | 1,132.7 | 1,360.8 | 1,511.1 | Oranga Tamariki | 1,430.1 | 1.0% |
| 448.8 | 518.4 | 524.9 | 1,412.3 | 1,558.8 | Foreign Affairs | 1,788.2 | 1.2% |
| 1,682.7 | 1,988.0 | 2,074.7 | 2,156.2 | 2,321.9 | Police | 2,380.4 | 1.6% |
| 1,741.3 | 2,176.9 | 2,106.8 | 2,328.3 | 2,379.2 | Corrections | 2,457.2 | 1.6% |
| 1,744.3 | 1,734.7 | 1,945.1 | 2,275.9 | 2,512.0 | Labour Market | 2,640.2 | 1.8% |
| 876.8 | 707.9 | 853.3 | 1,215.8 | 2,084.8 | Environment | 2,921.9 | 1.9% |
| 1,713.7 | 2,062.2 | 2,796.9 | 4,156.0 | 3,705.4 | Business, Science & Innovation | 3,501.0 | 2.3% |
| 2,906.8 | 3,149.0 | 6,414.4 | 3,301.0 | 3,784.0 | Defence Force | 3,748.3 | 2.5% |
| 0.0 | 1,121.8 | 1,602.0 | 2,153.8 | 3,281.7 | Housing and Urban Development | 4,388.5 | 2.9% |
| 3,289.5 | 2,919.1 | 3,617.7 | 4,845.0 | 6,645.3 | Transport | 7,021.0 | 4.7% |
| 5,706.7 | 6,721.0 | 16,365.1 | 19,149.2 | 26,679.1 | Treasury & Finance | 18,153.2 | 12.1% |
| 8,832.4 | 15,403.5 | 17,550.3 | 17,347.2 | 19,998.3 | Education | 20,182.9 | 13.4% |
| 15,666.7 | 16,780.0 | 18,584.3 | 21,047.8 | 27,569.9 | Health | 22,811.4 | 15.2% |
| 22,081.9 | 24,974.6 | 40,046.4 | 32,725.8 | 39,595.4 | Social Welfare | 38,488.2 | 25.6% |
| $81,582 | $94,402 | $124,855 | $131,109 | $161,686 | Total Expenditure | $150,480 | 100% |
| $295,641 | $310,163 | $318,731 | $342,477 | $361,900 | GDP (nominal, per RBNZ) | $392,100 | |
| 27.6% | 30.4% | 39.1% | 38.3% | 44.7% | Govt spending as % of GDP | 38.4% | |
| and this compares with taxes collected as follows: | |||||||
| $93,337 | $100,486 | $99,848 | $116,012 | $124,529 | Total Revenue | $137,652 | |
The data in this table is net spending, after fee and charges revenues have been deducted from the gross expenditure planned.
Sources: You can download the data behind these tables from the NZ Government website here.
15 Comments
Wow, essentially doubled in four years. My Wellbeing doesn't feel 2X better....
Great summary table...
Parliamentary Counsel up 30% in 2 years?, massive increase in transport and defense costs and statistics of all things... +100%.. (?!?) relative to 4 years ago
Why is roughly ~41% of the total budget focused on healthcare and social welfare?
Since 2018 we've seen an 8% GDP increase in government spending across the board to 38.4%, from an earlier % of 27-30%
Because super is a massive drain by the retiring boomers. By far the biggest social welfare spend.
now that's inflationary spending....go granter...
... did you get the impression from yesterday's budget that Grant was doling out goodies alike a lolly scramble ... thinking us kiddies would be grateful , scrambling around trying to pick up some sweet treats he's scattered around us ...
Like I say to my kids any idiot can spend someone else's money, only the clever ones know how to make it.
granter
Gold.
Social welfare almost doubled in 5 years. Lovely.
How many more boomers turned 65 over those 5 years. Social welfare payments also increased.
Good information.
Frightening to see the growth in "Social Welfare" (which predominantly seems to be pension funding) and Health numbers. Ideally these should be held in line with GDP as the population ages because otherwise we'll end up with excessive tax burden on the working age population.
Had the usual chat with a boomer about how they paid tax all their life etc the other day. I said I hope your government saved it somewhere to pay for your retirement like we are with NZ super fund and KiwiSaver. But no their government spent it on them because that’s what they voted for, and now I have to pay for their retirement as well as my own. Meanwhile some property developer makes millions in capital gains and doesn’t pay a cent in tax and also gets a free retirement. Pays not to work in this country.
Just give them some data to work with.
- Boomer couple, each person receives $18k per year in pension.
- Average Life Expectancy NZ = 81
- 16 years x $18k = $290k
- Median Wage = $56k, PAYE = $10k
- $290k ÷ $10k = 29 years of 100% PAYE just to fund 1 Boomer.
But yes, Muldoon got the vote because the Kiwisaver Scheme labour introduced in the 70s was deemed "communism" so there was no intent on that generation ever saving for their own retirement.
Would be nice if pensions were split out of welfare. Or maybe welfare split into the various types given each type is still a big chunk of the pie. Dole / DPB / Boomers / PI supplement / other welfare maybe.
They're spenders [not even savers] and certainly not earners. They think to earn is something for your parents ashes.
Well if their going to give out increasing pensions to people,
Then surely they should be doubling down on NZ Super fund contributions to offset?! by a multiple of 2 or more?
But no, they would rather cut back on the super fund and spend it on non wealth generating general expenses
We welcome your comments below. If you are not already registered, please register to comment
Remember we welcome robust, respectful and insightful debate. We don't welcome abusive or defamatory comments and will de-register those repeatedly making such comments. Our current comment policy is here.