
By David Hargreaves
Well, the Government and the Reserve Bank have leapt into action aimed at taming that naughty, naughty Auckland housing market.
One thing that I hope comes out of all this is some sort of precise information about who's buying houses and where. And yes, it would have been nice to have that information first before measures to tackle the problems were announced, but there's no point in keeping on about it now.
All we can hope is that from this point onward very specific information will be forthcoming about property purchases and ownership.
Then obviously any future Government policy decisions aimed at the housing market can be done on a highly informed basis.
Key factors in the current Auckland housing market in terms of the demand side of the equation are the number of houses bought by investors and also - given what the RBNZ is now doing - the portion of cash buyers, IE those blessed types that don't need a mortgage millstone.
The RBNZ's official nationwide figures - published only since last year - show that investors are currently making up about 33% of new mortgage approvals for the whole country. But the Reserve Bank has itself for a little while been quoting ball-park figures that they think about 40% of house purchases in Auckland are being made by investors.
Hence the fact that the investors are now being targeted. The RBNZ says that after October 1 Auckland investors cannot borrow more than 70% of the value of the property they are buying.
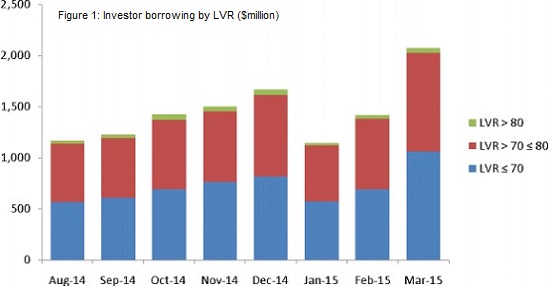
This should prove a pretty significant change. The RBNZ's own breakdown of the national borrowing figures (note, that's national, not Auckland) shows that at the moment the proportion of investors borrowing between 70% and 80% is considerable, as demonstrated by this graph:
But, notwithstanding those figures, the RBNZ's proposed measures could at the very least be weakened by the number of people buying houses without mortgages.
Last week Deputy Governor Grant Spencer gave some New Zealand-wide ball-park figures, stating that it was the RBNZ's belief that the proportion of cash buyers - which includes both Kiwis and overseas buyers "gets up toward 20%", while the number of new-to-market sales, in other words new entrants into the market who are not first home buyers was in the "8-10% range".
“So, there’s numbers that suggest it could be – we’ve talked about this before – the non-resident component could be around 10%, that sort of territory. We don’t think it would be significantly greater than that,” Spencer said.
The RBNZ sources this information from property information, analytics and services provider CoreLogic.
We were keen to see how the Auckland figures alone shaped up, so approached CoreLogic and they were good enough to provide us with some summary figures for the Auckland market between 2005 and this year.
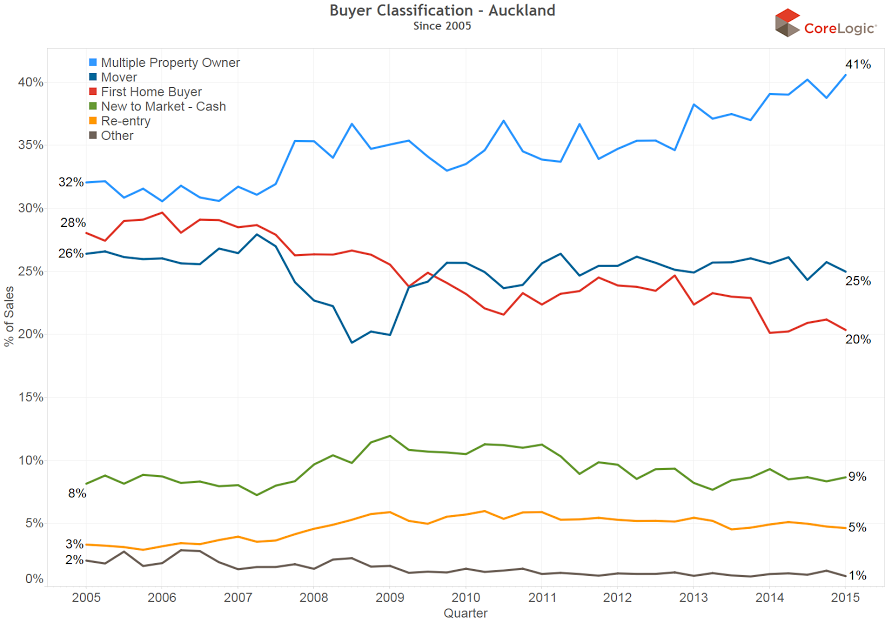
As you can see, the figures show investors now heading north of 40% in terms of the proportion of house sales they account for.
The new entrant to market figure, which the RBNZ seems to be taking as a proxy for foreign investors is running at 9% in Auckland. CoreLogic actually estimates the numbers of foreign investors to make up between half and 80% of this percentage - so on that basis foreign buyers buying for cash could make up between 4.5% and a little over 7% of the Auckland total.
But of course foreign buyers are also included in the investors category, so how many they actually are remains open to conjecture.
Likewise, the "new entrant cash buyers" are not the only cash buyers, given that cash buyers can also be included in other categories.
So, to go back to the fact that cash buyers might not be affected by the new RBNZ measures, can I say I thought Spencer's assertion that as many as 20% of house purchases nationwide might be for cash seemed pretty high and therefore potentially disruptive to the RBNZ's plans.
*In fact, according to CoreLogic and their detailed figures, the proportion of cash buyers, when you put them together from the various categories is nationally rather higher than that 20%, at just under 27%, having been as high in recent years as 30%.
That's a lot. In Auckland the figures are somewhat less than that, coming in at near to the deputy governor's 20% - although perhaps that should not be surprising since you would need way more cash to buy the average Auckland house!
CoreLogic provided us with this (at right) summary table of cash v credit house purchasing in Auckland since 2005:
| Year | Cash | Mortgaged |
| 2005 | 17.32% | 82.68% |
| 2006 | 17.19% | 82.81% |
| 2007 | 17.01% | 82.99% |
| 2008 | 22.22% | 77.78% |
| 2009 | 23.57% | 76.43% |
| 2010 | 25.93% | 74.07% |
| 2011 | 22.68% | 77.32% |
| 2012 | 19.19% | 80.81% |
| 2013 | 18.83% | 81.17% |
| 2014 | 20.12% | 79.88% |
| 2015 | 19.45% | 80.55% |
| Grand Total | 19.84% | 80.16% |
As you can see, there's a fair proportion of people who won't be directly affected by the new RBNZ measures. Whether that will weaken the effectiveness of the measures, only time will tell. But it certainly might do.
What is not arguable from CoreLogic's research is that the numbers of investors are on the march, while first home buyers are shrinking.
I was interested to see how the figures, which of course are proportionate, match up against the raw house sales figures produced by REINZ.
If you go back to 2005 there were 35,200 sales in Auckland, by 2010 there were just 19,564, while in 2014 this had bounced back up to 28,832.
According to CoreLogic investors made up 32% of buyers as at 2005, around 35% by 2010 and heading north of 40% by the end of last year.
In the same time frame the percentage of first home buyers dropped from 28% to around 23% to 20%.
New entrants to the market - including cash overseas buyers, have been quite consistent, at 8%, rising to around 12% at one point and then 9% heading into this year.
Just for illustrative purposes, if you use all these percentages against the REINZ Auckland house sales figures in 2005, 2010 and 2014, you would get 11,250 houses (IE based on the 32% figure given) bought by investors in 2005, dropping to 6,850 in 2010 and then arcing up strongly again to 11,500 (based on 40%) as of last year.
So, whether you want to talk about percentages or otherwise, the raw numbers of investor-buyers are certainly surging at the moment - demonstrating, I would certainly say, that the Auckland market is by no means a story only about supply. There's some demand there.
As for the suggestions that investors are taking up the slack left by first home buyers - well our illustrative comparison figures might suggest so. Again, based on the percentage figures and applying them to raw REINZ figures, this would suggest first home buyers bought something like 9850 Auckland houses (based on a 28% figure) in 2005, dropping to 4500 during the depressed days of 2010 and rising only weakly in comparison to other buyer category figures at around 5750 last year.
On the same basis, the new entrant figures are not showing much of a trend either up or down, giving us indicative figures based on the percentages of 2,800 in 2005, 2150 in 2010 and 2,600 in 2014.
All you can say is that all these figures suggest that some action on the Auckland market is warranted. Whether it works...only time will tell.
*An earlier version of this article ran a table of national cash/mortgage figures wrongly identified as Auckland-only figures. The table has now been amended with Auckland figures and some supporting text has been altered slightly. Apologies for the initial error.
We welcome your comments below. If you are not already registered, please register to comment
Remember we welcome robust, respectful and insightful debate. We don't welcome abusive or defamatory comments and will de-register those repeatedly making such comments. Our current comment policy is here.