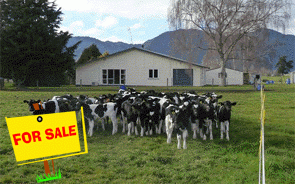
There were 111 farm sales in August, 5% more than August last year and more than 50% above the average over the past four years, the latest REINZ data shows.
In the three months to August there were 369 sales, down from the 438 sold in the same period a year earlier.
"The relatively constrained sales figures for August are due, in the main, to many farmers still being focused on peak seasonal workloads as opposed to trading property", said REINZ rural spokesman Brian Peacocke.
"The combination of the mix of extremely favourable on-farm conditions, kind weather and early grass growth being the best experienced by many, and the prospect of increasing levels of income is being reflected in the mood of optimism prevailing in the rural sector. The livestock market in saleyards around the country is buoyant and a healthy barometer for the rural environment," he said.
"Because of those conditions, the majority of farmers are in good spirits and many appear to be happy to retain their properties for now in order to capitalise on the higher returns being predicted by the export sector. The net result across New Zealand is strong demand, particularly for quality, sensibly-priced property, and a current shortage of supply."
"Whilst sales of dairy farms for the current period eased slightly, sales of finishing and grazing properties have held at steady levels in most regions. Horticultural sales have also been steady, reflecting increasing interest in the kiwifruit market, particularly in the Bay of Plenty district. In summary, the rural sector is in good heart and if the supply / demand situation remains as it is currently, prices will inevitably come under pressure."
Grazing properties accounted for the largest number of sales with 42.3% share of all sales over the three months to August, Finishing properties accounted for 25.5%, Dairy properties accounted for 9.5% and Horticulture properties accounted for 10.0% of all sales. These four property types accounted for 87.3% of all sales during the three months ended August 2013.
The median price per hectare rose to $21,676 in August 2013, 5% higher than a month ago, and 20% higher than August 2012.
Lower average prices were seen for arable and dairy units, while higher average prices were seen for finishing and grazing properties compared with those same categories in July; all others were stable.
August sales included:
5 arable farms,
8 dairy farms,
27 finishing units,
49 grazing properties,
14 horticultural,
8 farms of other types
-------------------------------------------------------------------------------------------------------------------------------------------
Farms For Sale: the most up-to-date and comprehensive listing of working farms in New Zealand, here »
-------------------------------------------------------------------------------------------------------------------------------------------
The number of sales is presented here, without the average price, because average prices bounce around dramatically depending on the size and type of business unit being sold. However, the following table sets out the median prices per hectare over the past three months, as reported by REINZ.
| $/ha - August 2013 | Arable | Dairy | Finishing | Forestry | Grazing | Hort | Special | |
| New Zealand | 25,833 | 32,234 | 26,107 | 6,744 | 16,744 | 127,667 | 116,614 | |
| Northland | 13,314 | 12,857 | 6,004 | 9,820 | 91,637 | 294,175 | ||
| Auckland | 150,738 | 39,286 | 43,879 | 9,955 | 18,685 | 244,829 | 149,839 | |
| Waikato | 14,065 | 16,706 | 44,706 | 16,031 | 640,621 | |||
| Bay of Plenty | 47,551 | 28,681 | 31,801 | 2,197 | 20,116 | 160,860 | ||
| Gisborne | 5,179 | 71,631 | ||||||
| Hawkes Bay | 29,575 | 16,476 | 20,615 | 17,207 | 74,678 | |||
| Taranaki | 40,870 | 39,267 | 103,202 | 1,915 | 33,453 | 907 | ||
| Wang/Manawatu | 20,776 | 19,020 | 7,485 | 11,804 | 19,671 | 136,065 | ||
| Wellington | 22,091 | 5,542 | 17,310 | |||||
| Nelson | 75,157 | 20,272 | 31,508 | 17,991 | 89,080 | |||
| West Coast | 17,021 | 6,563 | ||||||
| Canterbury | 38,967 | 29,064 | 17,701 | 21,115 | 35,985 | 12,462 | ||
| Otago | 20,249 | 12,435 | 10,072 | 16,353 | 150,000 | 104,119 | ||
| Southland | 37,519 | 35,441 | 24,113 | 21,232 | 18,421 |
for more perspectives, see
- Exchange rates
- Commodity prices
- Farm cost indexes
- Interest rate trends
- Rural credit aggregates
- Farm sales activity
- International dairy prices
for saleyard and processor price trend graphs, see

We welcome your comments below. If you are not already registered, please register to comment
Remember we welcome robust, respectful and insightful debate. We don't welcome abusive or defamatory comments and will de-register those repeatedly making such comments. Our current comment policy is here.