Select chart tabs
This is the official annual measure of productivity in New Zealand. Economists and statisticians agonise over the correct measures for national productivity, and the arguments get very technical, very quickly.
Productivity is the relationship between 'inputs' and 'outputs' - if you get more value out than the costs you put in, then you have rising productivity.
Note that 'productivity' is quite different to 'production'. Production is only the output.
Obviously, if you put in more effort (labour and capital) than you get out in production, that is unproductive - you would have been better off by not making the effort in the first place.
But our standard of living will only improve if we are productive (more outputs than inputs), and we can buy more of what the world offers ONLY IF we are more productive than other countries - otherwise in the long run, we will only be able to buy less of what the world offers as they power ahead of us.
Long-run productivity matters - and it really matters that we are more productive than the first-world economies we benchmark against. If we slip behind, we are bequeathing future generations a lower standard of living than we have (and that is irresponsible).
This series is the official one - and it only reports on the "measured sectors". Much of the public sector is not included (although most SOEs are).
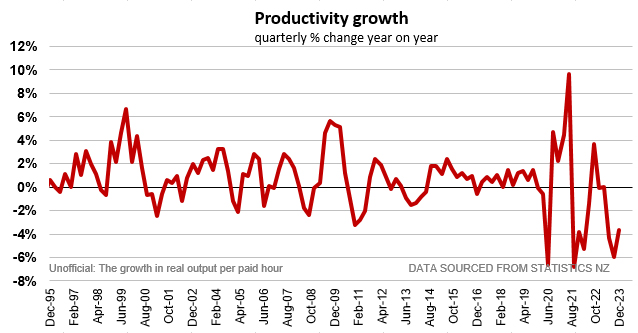
We also prepare a separate quarterly series, completely unofficial, that compares the growth in the output of our economy (real GDP) with the growth in effort we put in for that output (paid labour hours). (Note: The shape of this chart will change after each GDP release and these changes can be significant when Statistics NZ makes widespread revisions to earlier data, as they did in Q3-2012.)