
The charts referred to in this article are set out in the full paper here. This item is reposted with permission.

The NZD/USD has fallen as much as 10% this year, with a steady decline from mid-April through to mid-August. While the NZD has performed better over the last couple of weeks we think it’s an appropriate time to ask the question: in a longer-term context, has the NZD overshot fair-value to the downside?
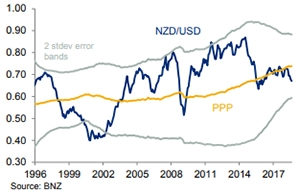
Regular readers will be familiar with the framework we use to assess long-term fair value. Our preferred methodology is to apply the theory of purchasing power parity based on CPI ex GST indices and we run a 15-year moving average filter. We think that using a 15-year filter effectively allows for any structural adjustments in the economy over time. We ignore relative productivity trends, which are important for long-term fair value estimates in theory, but difficult to measure in practice.
We’ll run through the gamut of NZD crosses later, but firstly focusing on NZD/USD, based on our methodology, long-term fair value currently sits at USD 0.7370. The current spot rate sits about 9% below this long-term fair value estimate making the NZD the “cheapest” it has been since 2009, close to the depths of the global financial crisis. As we show later in the paper, the USD is richly priced and it is better framing the narrative along those lines than arguing that the NZD is cheap per se.
Our long-term fair value estimate has been creeping up over time. One year ago it sat at 0.7180 and two years ago it sat at 0.6980. About one-fifth of the rise in long-term fair value reflects lower NZ CPI inflation compared to the US, and four-fifths reflects our moving average filter. Fifteen years ago, the NZD sat below 0.60. As time passes, our methodology effectively down-weights this historical period and puts more weight on the more recent period. Based on our projections, long-term fair value is expected to settle around 0.74 over the next couple of years.
There is no right or wrong way to calculate PPP estimates. One potential criticism of our methodology is that the time period we use is too short. Using a 25-year filter, long- term fair value drops to 0.6730. Using an even longer period – 33 years since the March 1985 float – long-term fair value drops to 0.6560. These different estimates are illustrated in the chart above.
Interestingly, the gaps between the PPP-15 year estimate and the longer term estimates have grown over the past few years. Much of this variation reflects what happened more than 15 years ago.
One potential benefit of our short-term methodology is that it is faster to pick up structural trends in the economy. As is well known, NZ’s terms of trade broke significantly higher in the early 2000s as emerging market economies became richer, demanded more commodities and this drove commodity prices higher. NZ clearly benefited from this dynamic. There has since been no reversal of this trend. Indeed, NZ’s terms of trade have trucked on higher, reaching a record high last year.
This is valuable information that shouldn’t be discarded when thinking about some sort of long-term fair value estimate. The longer-term PPP estimates noted above down-weight this information, while our methodology better captures this information.
A more formal way of capturing the terms of trade in a long-term fair value estimate is to calculate a terms of trade-adjusted PPP. We did this using a regression that spat out the “best-fit” coefficient to apply to the terms of trade variable. For the NZD, this was a beta of just above 0.7. Using this methodology, the terms of trade-adjusted PPP is currently 0.8050. The evident NZD strength relative to conventional PPP estimates between 2004-2014 – a period where many observers were calling the NZD as significantly over-valued – can be largely explained by NZ’s sustained, strong terms of trade. This is not the sort of information we’d want to throw out when thinking about long-term fair value for the NZD.
Our gut feel is that 0.7 is “too-high” for the terms of trade weight in this model. When we performed the same analysis on AUD/USD the beta on the terms of trade variable was just under 0.5. Applying a 0.5 weight to the adjusted PPP NZD model gives a current fair value of 0.7530 and the time series is illustrated in the chart below.
The chart also shows how our preferred 15-year PPP filter tracks against the terms of trade adjusted PPP. It highlights how using the 15-year filter rather than the longer term measures captures some of the terms of trade dynamic that one might like to incorporate into a long-term fair value estimate. Doing this analysis makes us more enamoured with our preferred 15-year PPP estimate than the longer term estimates.
The rest of the paper shows our PPP estimates on the NZD crosses and other major exchange rates of interest. The NZD is still about 10% above our long-term estimates against JPY and GBP. NZD/CAD, NZD/EUR and NZD/AUD are well within the margin of error against our long-term fair value estimates. Our estimates for NZD/CNY are included just for interest but shouldn’t be taken too seriously. It is well known that this methodology overstates any apparent strength in emerging market currencies. Strong productivity growth in emerging markets ought to be taken into account when thinking about long-term fair value estimates. That is beyond the scope of this paper.
The final row in the Table below “standard deviations” shows that, excluding CNY, no NZD crosses are more than one standard deviation away from long-term fair value. While we can point to some overs and unders versus fair value, there don’t seem to be any serious misalignment of NZD exchange rates in our view. The NZ dollar’s broadly based depreciation over the past couple of years has closed up previously prevailing significant levels of long-term misalignment.
On a TWI basis, the NZD is fairly priced on this methodology, when excluding CNY (we also exclude the Asian currencies, including only six majors which make up about 75% of the index).
Our PPP estimates have little bearing on our 1-2 year-ahead projections, which are driven more by cyclical and short term factors, but they do play a role in thinking about the longer term outlook. The key take-out from this analysis is that corporates with a 3-5 year focus should be counting on lower NZD/GBP and NZD/JPY exchange rates, while NZD/USD can be expected to settle higher over that timeframe.
The next five charts show the NZD crosses and our preferred PPP estimates using the 15-year filter. Following those charts we look at USD majors.
Looking at the key USD exchange rates, the USD looks richly priced across the board. EUR, GBP, AUD, CAD and JPY all trade below fair value against the USD in the order of 10-20%. On a DXY index basis, the USD is trading about 15% above our long-term fair value estimates.
It is not hard to understand why the USD looks broadly overvalued. The US monetary policy tightening cycle is well ahead of other countries, reflecting tighter capacity constraints and higher inflationary pressure than other countries. The USD has been doing some of the heavy lifting to balance global growth conditions out.
As the US economic and policy cycle matures, we can expect to see the USD reverse course and fall on a broad basis. Under those conditions we’d expect to see the NZD move sustainably back above 0.70, in the absence of any major global shock. But the near-term outlook is for a sustained period well below our long term fair value estimate. We see NZD/USD spending much of the time hovering in the high 0.60s through to the end of next year.
The charts referred to in this article are set out in the full paper here. This item is reposted with permission.
Get our daily currency email by signing up here:
Daily exchange rates
Select chart tabs
BNZ Markets research is available here.
We welcome your comments below. If you are not already registered, please register to comment
Remember we welcome robust, respectful and insightful debate. We don't welcome abusive or defamatory comments and will de-register those repeatedly making such comments. Our current comment policy is here.