

Treasury is expressing relative comfort with sharp rises in debt that have seen New Zealand's household indebtedness reach record levels - but says there are risks around the more recent decline in savings. And it has an Auckland-specific warning about rising debt levels of new housing entrants.
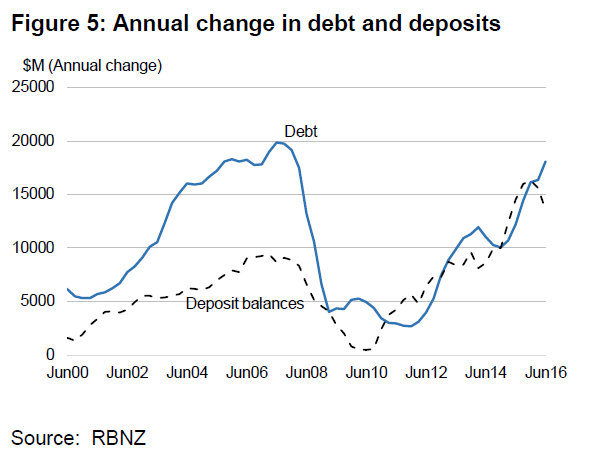
In a special feature in its latest Monthly Indicators publication, Treasury says rising net financial wealth and the pattern of an approximate matching of debt growth and deposit holdings were "reasons to help balance concerns about rising indebtedness".
But continuation of a more recent decline in savings may over time change the view.
"Since the global financial crisis, there has been quite a marked change in household saving behaviour.
"Between 2010 and 2014 household saving was positive following negative rates over the nine years prior (Figure 4).
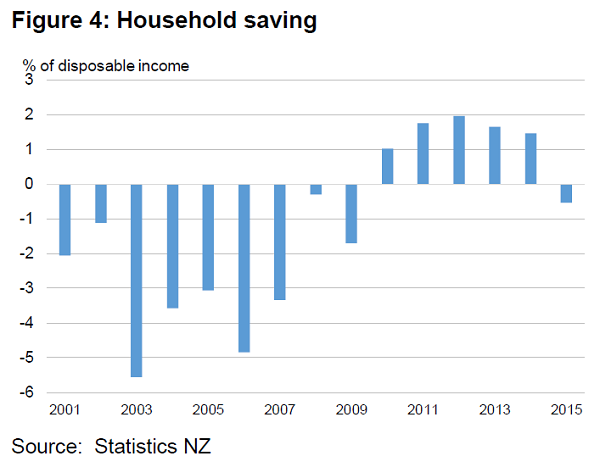
"Saving turned slightly negative in 2015 reflecting a large fall in farm income which declined by 2.5 percentage points of disposable income. Nevertheless, the rate of dissaving (at 0.5%pts of disposable income) was modest relative to the mid-2000s.
"The recent divergence shown in Figure 5 is still too short and small to call a trend, but if it were to continue may challenge a relatively sanguine view of household indebtedness."
Treasury said that from a macroeconomic perspective, it is not clear what levels of debt are “too high” or problematic with the ability to take on debt playing an important role in enabling households to spread the cost of expensive assets, such as housing, across time. At an aggregate or macroeconomic level several features of the recent build-up of debt limited concern, namely:
• The accumulation of debt has to date not been the result of sustained dissaving;
• Debt servicing rates are well within historical ranges and may fall further;
• Net wealth and (until recently) net financial wealth has been increasing; and
• Housing debt to asset ratios have fallen.
"While debt levels have been rising, declines in interest rates have meant that debt servicing has fallen. Debt servicing (interest costs) peaked at 14% of disposable income in 2008. As interest rates have fallen debt servicing costs declined to 8.4% of disposable income in 2013 and currently sit just below 9%.
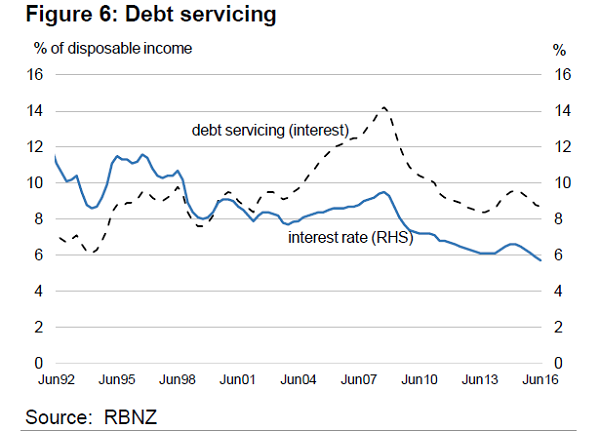
Treasury said the future evolution of debt servicing rates will be influenced by both the accumulation of debt and interest rate developments.
"With current market mortgage rates below the average interest rate currently being paid, it is likely that average interest rates will continue to decline over the year ahead."
However, future increases in interest rates would increase debt servicing rates.
"Whether this results in debt servicing rates exceeding previous highs will depend on the extent and timing of interest rate increases. Housing debt relative to the overall value of housing assets fell to a series low (dating back to 1998) of just under 24% in March 2016 after being just below 29% at the start of 2009 and in late 2001. House prices would need to fall around 17% for leverage to return to its previous peaks."
'Issues may be hidden'
Treasury said the focus of "this special topic" in the monthly indicators publication has been on aggregate household wealth data, "it is possible that this may hide issues if debt is concentrated in particular groups of households".
"In particular, high Auckland house prices mean that new entrants need to take on high debt levels.
"Estimates of debt servicing ratios for representative new buyers in Auckland are elevated (around 46% of income) even with current low interest rates. They would pass previous peaks if mortgage rates were to return to their 10-year average of 6.7%."
Treasury's definition of "a representative buyer" is one buying an average value house, on an average income, with a 20% deposit.
"Actual new buyers may face higher or lower debt servicing rates depending on their particular circumstances. Previous research covering buyers during the 2005 to 2013 period highlighted that new buyers on average had disposable incomes that were 40% higher than the overall median.
"Nevertheless, debt servicing rates for many new buyers are likely to be relatively high at a time when interest rates are relatively low."
'More exposed'
Treasury said "almost by definition", higher debt levels mean that households are more exposed to increases in interest rates.
However, in the absence of positive demand shocks, it is unlikely that interest rates will rise over the next few years. Domestically driven increases in interest rates via increases to the official cash rate will be dependent on inflationary pressures increasing as domestic activity grows. This is likely to be associated with stronger nominal income growth and an improving labour market.
Higher rates of debt mean that monetary policy may be more effective in influencing demand with interest rates not needing to rise as much as in the past, Treasury said.
"Overall, at the macroeconomic level there are reasons to limit concern about household debt developments, while being cognisant of the risks.
"These risks may increase if the most recent developments of declining net financial wealth were to continue or accelerate."
9 Comments
The debt rate post-GFC is probably related to equity, compared to pre-GFC. The lower savings rate prior to the GFC represents a time when people were ramping up on debt based on their existing savings.
Please correct me if my deduction doesn't make sense.
if govt doesn't spend (because surplus) then we'll have to...
It isn't so much about the spending Ian, it is about the consumption of resources. That is what economic growth boils down to. But you are right, if the private sector won't, or can't, then the government can step up. Be careful what you wish for. The step towards government control over the consumption of resources, or control over production, is a step towards fascism.
You could also end up with a situation of everybody eating, but nobody growing.
Capitalism (or creditism): The most efficient system for the exponential consumption of finite resources.
These graphs are related to h'hold debt and savings rates, not public debt, but your point is taken.
A bit disturbing to read this:
"Treasury says rising net financial wealth and the pattern of an approximate matching of debt growth and deposit holdings were "reasons to help balance concerns about rising indebtedness"."
The matching of debt growth with deposit holding is not a pattern! debt growth causes deposit holdings, - it is the nature of lending in this banking system, and which Treasury and the RBNZ seem to be blind to. As soon as we get lending growth diminishing (which we must to avoid a crash), then we will see deposit growth diminishing, thus purchasing power diminishing, thus GDP growth reductions, thus deposit growth diminishing etc. etc i.e. the reverse of what is happening now.
A large component of current GDP growth is a credit fueled illusion.
.
Yes, that is my understanding. The savings rate reflects debt accumulation.
Well said Peri.... And that makes the divergence between debt and savings even more meaningful... ( fig. 5 graph ).
ie... Savers are withdrawing.. in spite of the new deposits that are made as a result of new credit being created.
The main question left unanswered is why does treasury exist if they can't actually read graphs?
"it is possible that this may hide issues if debt is concentrated in particular groups of households".
So lumping everybodies data together MAY hide issues?
So the net wealth of the homeless lumped in with the boomers MAY hide trends?
We welcome your comments below. If you are not already registered, please register to comment
Remember we welcome robust, respectful and insightful debate. We don't welcome abusive or defamatory comments and will de-register those repeatedly making such comments. Our current comment policy is here.