

On a global scale New Zealand has in recent years had among the biggest house prices rises - along with one of the highest rates of population growth and one of the biggest falls in mortgage interest rates.
These are some of the findings of research undertaken by the Reserve Bank (RBNZ) to better understand the sustainability of house prices in New Zealand. RBNZ chief economist Paul Conway gave a speech on Thursday that summarised some of the research.
In a paper called: How do we stack up? The New Zealand housing market in the international context, the RBNZ's Hamish Fitchett and Punnoose Jacob have looked at NZ's housing market in comparison with 12 other developed nations between 1991 and 2021.
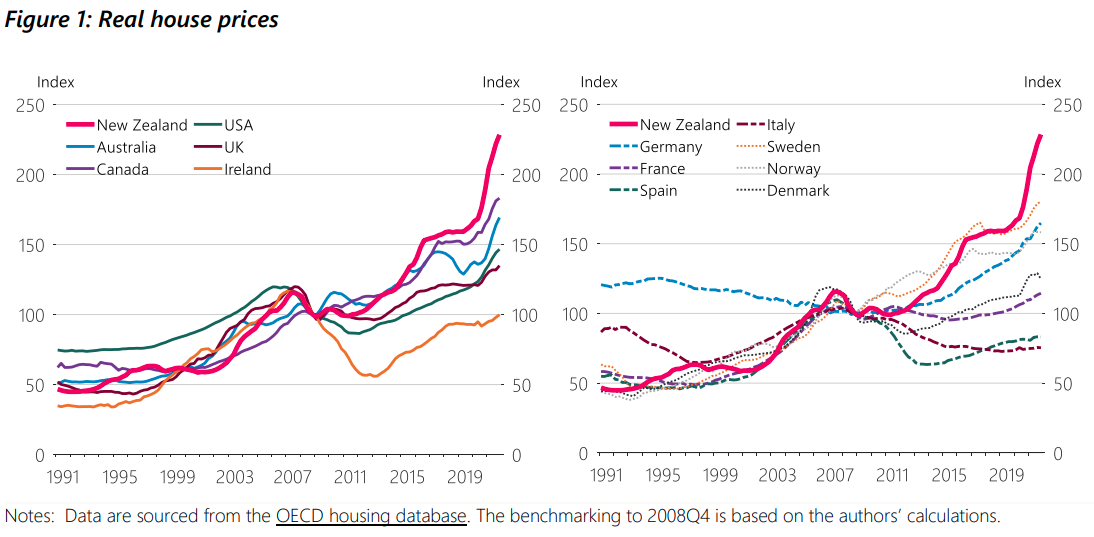
They say that until the Global Financial Crisis in 2008, the progression of New Zealand house prices was broadly in line with those in most other countries; but the pattern changed after the GFC.
"Real house prices in New Zealand flattened for a few years following the GFC, before undergoing a rapid escalation.
"The rise in New Zealand house prices since 2008 exceeds that of all other economies in our sample," the report's authors say.
"The upward surge in New Zealand house prices has also pushed New Zealand to the upper end of the cross-country spectrum with regard to two other key indicators of the housing market; the price-to-rent-ratio and the price-to-income ratio."
The authors note that demand for housing strengthens as the population increases and the interest rate costs of mortgages decline.
"Figure 5 examines population growth rates in our sample. New Zealand has been at the upper end of the range for much of the past three decades when it comes to population growth. Albeit from low levels by world standards, New Zealand’s population, buoyed by high immigration, has grown rapidly," they say.
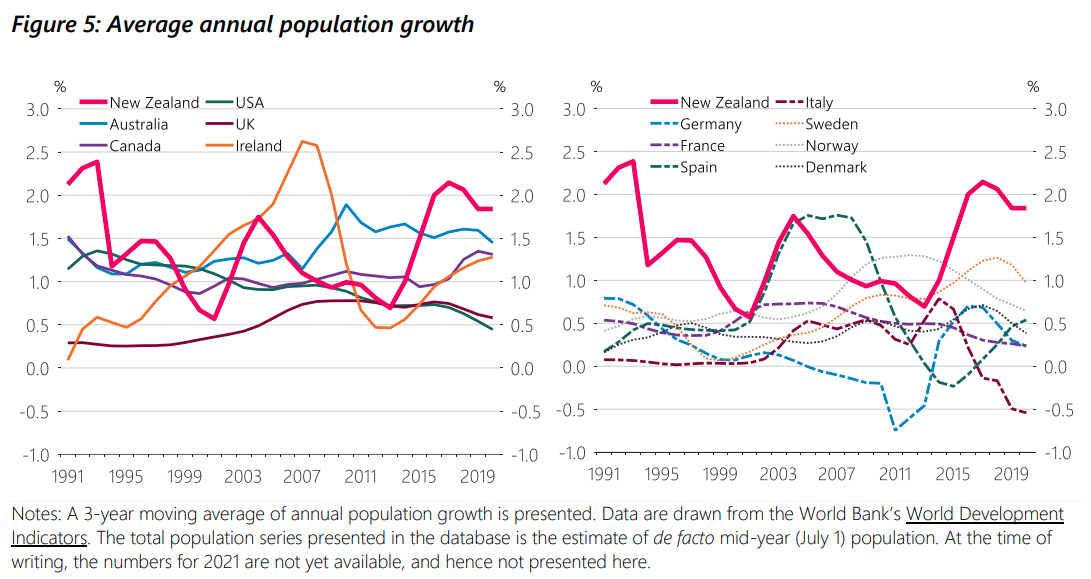
Fitchett and Jacob say that even though net immigration fell in the immediate aftermath of the GFC, it started rising after 2011, and kept strengthening till early 2016 and remained at high levels.
"Population growth in other economies has been relatively weaker, and even negative in Germany, France and Italy during several episodes in the last 15 years."
On mortgage rates, the authors say that comparing rates across countries is difficult because the types of mortgage contracts that are relevant vary across economies and possibly also over different periods.
"With this caveat in mind, Figure 6 illustrates the persistent fall in selected mortgage rates for most of the economies in our sample, after the GFC.
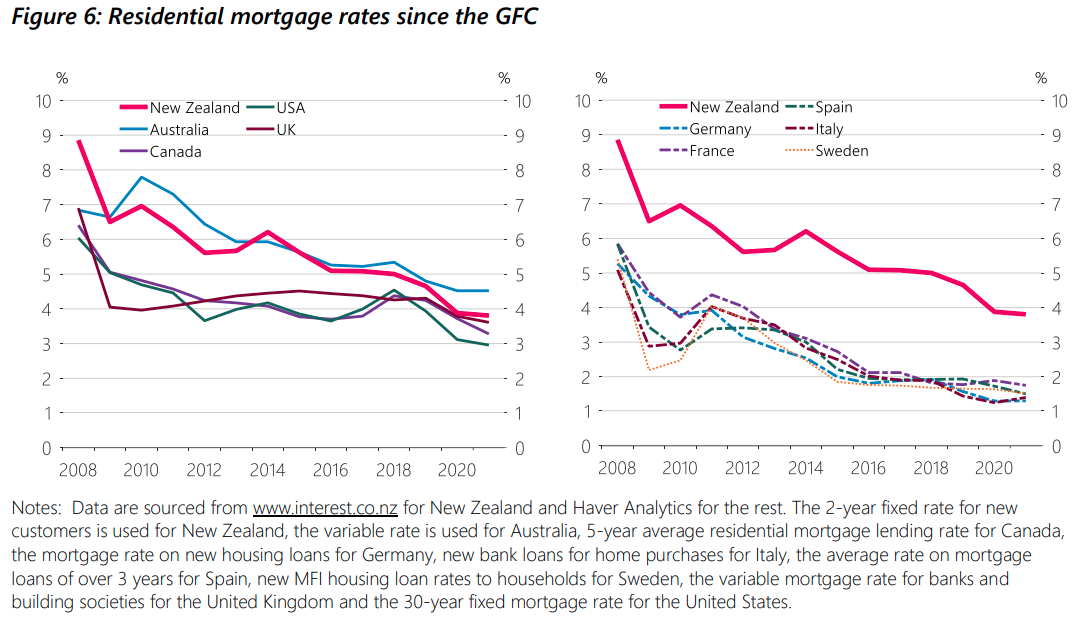
"The New Zealand mortgage rate started at a higher level than those in other economies in 2008.
"Between mid-2008 to mid-2009, the [Reserve] Bank eased the Official Cash Rate by 575 basis points.
"This in turn reduced the interest rate cost of mortgage debt to, what was at the time, historically low levels. After increasing mildly till about 2014, the mortgage rate declined continuously.
"By 2021, the New Zealand rate appears to have fallen the most in our sample; about 500 basis points."
The authors then present 'Figure 7', which presents scatter plots that compare the changes in population (left panel) and mortgage rates (right panel) since 2008 to the change in real house prices over the same period.
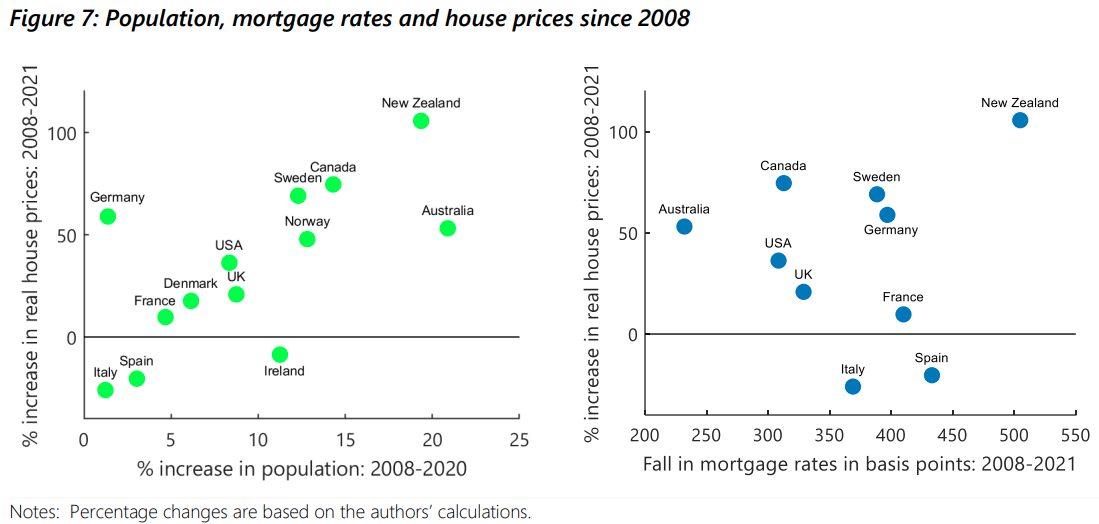
"Two key messages emerge from the figure," the report authors say.
"Firstly, it suggests that house price increases after the GFC correlate stronger with population increases across countries while the corresponding correlation with declines in mortgage rates is weaker.
"Secondly, not merely has New Zealand experienced the strongest house price increase since the GFC, it has also been accompanied by almost the steepest increase in population and the strongest decline in mortgage rates across our sample economies."
Fitchett and Jacob say residential construction in New Zealand has progressed at a rapid pace after the Global Financial Crisis, in fact, more rapidly than in most other economies.
"However, New Zealand’s population has also grown at an increasing rate, again almost the highest in our sample.
"This mismatch has constrained the availability of dwellings; the number of dwellings available per inhabitant steadily declined over most the 2010-2020 period, and was the lowest among all the economies we consider."
The authors say the relatively weak supply of housing in New Zealand was accompanied by construction cost inflation that was high by international standards.
"On the other hand, the demand-side of the New Zealand housing market was buoyed by robust population growth, and mortgage rates that experienced the strongest post-GFC decline among the economies we considered."
The lower interest rate cost of mortgage debt along with robust population growth are likely to have supported an increase in the demand for houses. The combination of strong demand and limited supply generated an escalation of house prices in New Zealand, more so than in other economies, Fitchett and Jacob say.
"To sum up, the combination of relatively stronger demand-side factors and the relatively constrained supply-side factors pushed New Zealand house price inflation to the upper end of the cross-country spectrum."
*This article was first published in our email for paying subscribers. See here for more details and how to subscribe.
We welcome your comments below. If you are not already registered, please register to comment
Remember we welcome robust, respectful and insightful debate. We don't welcome abusive or defamatory comments and will de-register those repeatedly making such comments. Our current comment policy is here.