Global rates are lower, with a downward surprise to US initial jobless claims proving to be only a short-term interruption to the move. Despite a fresh low for the yuan, the NZD and AUD have managed to hold their ground against the USD, unlike EUR and GBP which have fallen to fresh three-month lows.
US initial jobless claims fell 13k to 216k last week, its lowest level since February and below expectations for a small lift. The figures could have been distorted by holiday factors, coming a week before Labour Day, and Hurricane Idalia – where the usual reaction after a natural disaster is lower claims initially, followed by a jump. As such, the market hasn’t over-reacted to the data.
US Treasury yields and the USD moved higher after the release, but the move wasn’t sustained. The 2-year rate rose 4bps to at peak of 5.03%, before a steady fall to the current 4.95%, down 7bps for the day. The curve has steepened, with the 10-year rate rising to as high as 4.30% and now trades at 4.26%, down 2bps on the day.
Global rates are broadly lower. UK rates showed falls led by the short end of the curve, with the 2-year Gilt down 10bps to 5.12%, the move supported by data showing lower business inflation expectations. The UK 10-year rate is down 8bps, while Germany’s is down 4bps. Bank of Canada Governor Macklem hinted that the tightening cycle might be over, saying “with past interest rate increases still working their way through the economy, monetary policy may be sufficiently restrictive to restore price stability”. Canadian rates are also lower across the curve.
In other economic news, Germany industrial production fell for a third consecutive month in July, to its lowest level since December. Factors cited for weaker industrial activity include poor demand from China, worker shortages, higher interest rates and the lingering fallout from last year’s energy crisis.
Yesterday, China trade data weren’t as bad as feared, with exports and imports contracting at a slower pace on an annual basis and monthly seasonally adjusted estimates implying some consolidation in exports and a pick-up in imports. But the data didn’t prevent the yuan from weakening further, even with the ongoing PBoC’s heavy hand with the daily CNY reference rate fixing. USD/CNY rose through the late-2022 year high, taking the onshore yuan to its weakest level in 16 years at just under 7.33. The offshore yuan didn’t suffer the same fate, but got close, and currently trades over 7.34.
China is showing further signs of decoupling from the US. Consulting firm Rhodium Group published data showing the value of foreign direct investment in the US slumping to $2.5b last year, a fall of more than 50% from 2021 and the smallest since 2009. FDI as recently as 2016-17 was in the order of $30-$40b. The firm noted that China has gone from one of the top five US investors to a second-tier player. The trend in merchandise trade data show the share of Chinese imports from the US declining further, a trend that kicked off from 2018 after President Trump initiated a US-China trade war.
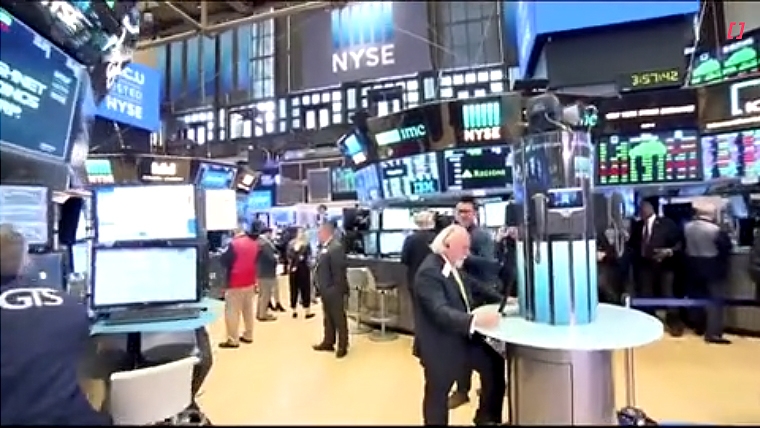
Apple shares show another fall of over 3%, seeing some $200b wiped off its market value over two days, following China’s plans to expand a ban on the use of iPhones to government-backed agencies and state companies – playing to the lack of trust between the US and China and the de-coupling theme. Weaker tech stocks have been a drag on the S&P500, currently down 0.4%, with a larger fall for the Nasdaq index. Just over half of the S&P sectors are in positive territory so the equity market declines cannot be considered broadly based.
In currency markets, of note, the NZD and AUD haven’t been dragged down by the weaker yuan and both currencies, alongside JPY, have been the best performers overnight, although net moves on the day have been small. Yen gains can be attributed to the backdrop of lower global rates, with USD/JPY pushing down towards 147. The NZD currently trades at 0.5880 while the AUD is at 0.6380. The EUR, GBP and CAD all show small falls against the USD. EUR has traded below 1.07 for the first time since June while GBP has sustained a move below 1.25 and is also at a three-month low. NZD crosses are mostly higher apart from a small fall against JPY.
Yesterday, the last of the key NZ Q2 activity indicators were released that allowed us to finalise our GDP estimate. Much stronger than expected manufacturing sales volumes and a better pulse in some of the services sector indicators resulted in an upgrade in our GDP estimate from 0.3% to 0.6% q/q. This follows two negative quarters and, after accounting for strong population growth, still conveys a very weak economic backdrop. The RBNZ projected 0.5% at the August MPS, so there is little impact for the market.
The NZ rates market showed some surprising outperformance yesterday in the face of ample supply. The government’s bonder was well supported across all three lines on offer with rates above 5% and higher NZGB yields compared to swap, particularly for longer bonds, helping support demand at the tender. Strong demand was evident despite LGFA issuing $750m of new bonds earlier in the day. On a day of higher Australia yields, NZGBs were little changed on the day, with a 1bp fall for the longer maturities. The swaps curve showed a flatter bias, with the 2-year rate 1bp higher and the 10-year rate 2bps lower.
In the day ahead, the calendar is light, with Canada’s employment report the key release tonight. China inflation data are released over the weekend.

We welcome your comments below. If you are not already registered, please register to comment
Remember we welcome robust, respectful and insightful debate. We don't welcome abusive or defamatory comments and will de-register those repeatedly making such comments. Our current comment policy is here.