

It has been five days since ANZ bravely raised their fixed home loan rates - above the general market levels.
Now another major has shifted up too.
But it is Kiwibank, and they have only raise two specific rates, even if they are key ones.
Their one year rate has been raised to match ANZ, up +14 basis points to 3.99%. Their two year rates has also been raised to match ANZ, up +6 bps to 4.55%.
The move is opening up quite a carded rate separation between banks.
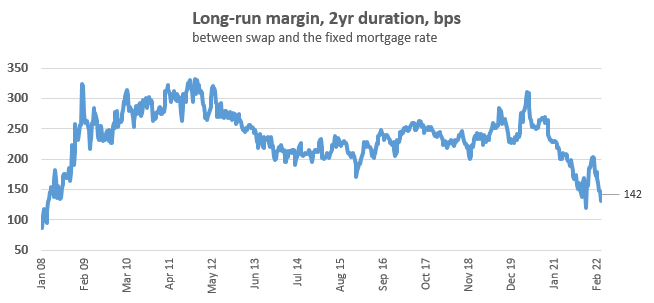
These rises come as swap rates rise relentlessly.
Yesterday the one year swap ended at 2.54% and a six year high, and up +24 bps in just the last week. The two year swap was up to 3.01% and the first time it has been above 3% since mid 2015. The two year is up +23 bps in a week.
At the pace of these rises, it seems unlikely any bank will be able to hold back for much longer. After all, the margin between the carded one year rate and the current swap rate at, say, ASB is now a very unusual 125 bps, unusual because it is very rarely this low. For the two year, that same margin is 134 bps, also very low. 'Normally' they hover between 190 bps and 210 bps.
In July 2015, most banks were offering two year fixed rates at 5.0% - a margin to swap of ~200 bps.
| 2yr | margin | 2yr | 2yr | margin | 2yr | |
| fixed | bps | swap | swap | bps | fixed | |
| 3 July 2015 | 3 July 2015 | 3 July 2015 | 15 March 2022 | 15 March 2022 | 15 March 2022 | |
| % | # | % | % | # | % | |
| ANZ | 4.99 | 197 | 3.02 | 3.01 | 154 | 4.55 |
| ASB | 5.10 | 208 | 3.02 | 3.01 | 134 | 4.35 |
| BNZ | 4.99 | 197 | 3.02 | 3.01 | 134 | 4.35 |
| Kiwibank | 4.99 | 197 | 3.02 | 3.01 | 154 | 4.55 |
| Westpac | 4.99 | 197 | 3.02 | 3.01 | 134 | 4.35 |
| -------- | -------- | -------- | -------- | -------- | -------- | |
| Average | 5.01 | 199 | 3.02 | 3.01 | 142 | 4.43 |
| "normal" | "unusually low" |
Later this week (Thursday) the US Fed will be reviewing its rates, and they set the international benchmarks. Overnight markets were of the view US Fed rates were going up and more than +25 bps is now a live possibility.
Yesterday, New Zealand swap rates moved higher as local bond yields responded to the US market shifts. After the overnight action, it seems reasonable to assume New Zealand swap rates will shift higher again.
After all, expectations are widespread that the RBNZ will lean into higher inflationary forces here, and do what they can, even if their actions alone can't stop the rises. But they can slow them.
Kiwibank's rises today haven't come with matching term deposit rises, yet anyway. Update: They have now raised term deposit rates between +10 bps and +20 bps.
One useful way to make sense of these changed home loan rates is to use our full-function mortgage calculator which is also below. (Term deposit rates can be assessed using this calculator).
And if you already have a fixed term mortgage that is not up for renewal at this time, our break fee calculator may help you assess your options. But break fees should be minimal in a rising market.
Here is the updated snapshot of the lowest advertised fixed-term mortgage rates on offer from the key retail banks at the moment.
| Fixed, below 80% LVR | 6 mths | 1 yr | 18 mth | 2 yrs | 3 yrs | 4 yrs | 5 yrs |
| as at March 15, 2022 | % | % | % | % | % | % | % |
| ANZ | 4.19 | 3.99 | 4.39 | 4.55 | 4.75 | 5.70 | 5.90 |
| 4.19 | 3.79 | 4.25 | 4.35 | 4.89 | 5.05 | 5.25 | |
| 4.09 | 3.85 | 4.19 | 4.35 | 4.65 | 4.89 | 4.99 | |
| 4.19 | 3.99 +0.14 |
4.55 +0.06 |
4.79 | 4.99 | 5.15 | ||
| 4.19 | 3.79 | 4.19 | 4.35 | 4.89 | 4.99 | 5.09 | |
| Bank of China | 3.85 | 3.65 | 3.95 | 4.15 | 4.45 | 4.85 | 5.05 |
| China Construction Bank | 3.85 | 3.85 | 4.09 | 4.35 | 4.65 | 4.95 | 5.05 |
| Co-operative Bank [*=FHB] | 3.59 | 3.59* | 4.19 | 4.35 | 4.75 | 4.99 | 5.09 |
| Heartland Bank | 3.25 | 3.79 | 4.15 | ||||
| HSBC | 3.94 | 3.75 | 4.15 | 4.25 | 4.49 | 4.74 | 4.99 |
| ICBC | 3.85 | 3.69 | 3.95 | 4.15 | 4.55 | 4.75 | 4.95 |
| |
3.79 | 3.55 | 3.95 | 4.10 | 4.55 | 4.74 | 4.95 |
| |
3.69 | 3.69 | 4.19 | 4.35 | 4.69 | 4.99 | 5.09 |
Fixed mortgage rates
Select chart tabs
Daily swap rates
Select chart tabs
Comprehensive Mortgage Calculator
42 Comments
only a matter of weeks until the 1 year fixed term has a 4 number in front of it.
It feels like only a few months since it got a 3 number in front of it...
Roughly this time last year we fixed our mortgage for 5 years at 3.05%. We upgraded into our forever home in December, we fixed for 5 years at 4.95%. Same bank, still above 40% equity.
Appears the amount of interest people are paying remains historically low to me, for all the handwringing these are still great times for most borrowers:
https://www.rbnz.govt.nz/statistics/key-graphs/key-graph-household-debt
Correct it is super low and inflation is super high.
And yet if you do the maths on repayments of a first home taking out a mortgage today you end up with a completely different story. so some hand wringing clearly justified.
No excuses then for the RBNZ to not ramp up the OCR.
The muppets at the RBNZ will bend over backwards in order to support the housing Ponzi for a little longer, so they will not increase rates with the speed and urgency now demanded by the circumstances. They will act too timidly, with 50 bps increases per step max, and this will force them to be much more aggressive later on, after the results of their delusional thinking become even clearer to everybody.
The OCR should be already at least between 3.5 and 4% right now - and even this level would still be seriously behind the curve. Orr must be sacked immediately and replaced with somebody with the competence and determination to take the unpopular (for some) but necessary decisions right now. He has already done enough damage, and even worse he is still pretending not to see the results of his misguided, reckless, ultra-loose monetary policy.
next raise will be .25 max and I'll bet the house(mouse) on it
Agree, .25 increase next month, Orr has shown his hand and made his intentions clear. If the consequences of his incompetence weren’t so serious, it would be laughable.
And how about the quantum of what you're drawing down? Do you get that a bigger % of a small number is sometimes a lot less than a smaller % of a vastly bigger number? Percentages have this pesky habit of being relative, I wish for my mortgage's sake it wasn't true but sadly it is.
This Weeks Hutt Valley Update ( for those who have seen my weekly updates)
610 houses on the market. REINZ data showed 96 sold in Feb – so less than 25 a week now selling – down from 40 a week this time last year.
If the current sales continue – that’s 6 months stock on the market. Using 40 a week its 15 weeks (close to 4 months stock on the market).
I was surprised to see Lower hutt’s Median Value jumped to a record $940 000 in yesterdays REINZ data. Using the sales data I record (which is the last listed price for the property) my data showed the Median house price was $895 000- but this was on sales of 30 houses.
From the 30 houses sold in Feb that I have a price for It appears there were a lot more houses sold over $1 Million in Feb (12) vs 18 which sold for less than 1 million. When I compare the 26 houses sold in Jan – only 7 were priced above $1 Million and 19 below 950K
It’s not necessarily a signal prices have lifted in the market- it appears the mix may be the big factor- a lot more 4 beds and 2 baths’s sold in Feb vs 3 bed and 1 bathroom in Jan. This could be a sign that a lot more owner occupiers bought in Feb than first home buyers and investors which typically are attracted to the smaller cheaper properties.
It did however make me curious what was happening at each price band – so I did some further segmentation. Looking at the houses listed with a price – which is 251this week
- 32% are priced over $1 Million – 36% of which have dropped their price. Average price decrease is 121K
- 11% are priced between $900K and $1 Million – 34% of which have dropped their price. Average price decrease is 73K
- 26% are priced between 800K- 900K – 45% of which have dropped their price average decrease is 47K
- 31% are priced below 800K – 49% of which have dropped their price. Average price decrease is 49K
So interestingly the top of the market is taking bigger price decreases (10% reduction on listed price ) than the bottom of the market – which are decreasing by about 5%
The data also shows the majority of houses listed are under 900K. The Median house price for all 610 listings is 850K
Time on Market
380 of the houses have been on the market for over 30 days - 62%
196 of the houses have been on the market for over 60 days - 32%
Rental Market
Meanwhile the rental market has 171 properties for rent (this is now extraordinarily high) – normally the properties for rent are 110-120 at any given time.
This would be deterring investors big time and is a market to watch. It would be a strong indicator of an oversupply of housing.
I have had some great feedback on my data in recent weeks ( Thankyou :) )
I realise this week's update is a bit wordy, happy to receive feedback on that and if you have any other suggestions on data you would like to see - happy to see what i can do
This is a very informative set of data that you are providing. We need these 'citizen contributions' to balance the massaged data that come from sources with conflicts of interest. Keep it up!
KeithW
Don't worry about the 171 houses for rent. They will be occupied by Ukranian refugees courtesy of the NZ Government in a matter of months.
"Don't worry about the 171 houses for rent. They will be occupied by Ukranian refugees courtesy of the NZ Government in a matter of months."
Sounds like another fake account from TTP Tim Mordaunt.
That actually won't be the worst thing to do from a humanitarian and economic point of view.
The Ukrainian workforce has high tertiary education rates by NZ standards. Ukraine produces the most number of STEM graduates each year in Europe, 2x the number of grad engineers in the UK.
It's one thing churning out lots of graduates, it's another as to what the quality of the institutions churning them out is like...
Likely better than our local institutions.
We should try investing even less in scientific research and education and see if that helps the matter. And focus on running universities as a job training business enabled by ever more student debt, rather than places of research and learning.
No increases in term deposit rates - more money siphoned off by banks.
Isn't it funny. People are outraged at the cost of fuel (rightly so I guess?). Take the total average fuel excise ($0.81), multiply by 50 litres (average full tank size), and multiply by 52 weeks you get $2100 of fuel excise per household.
Meanwhile, the Australian Banks collectively profit $6 billion in a year which is $1200 per person. In a 4 person household that's $4800.
Any reason why the banks cannot take a share in our "cost of living crisis"?
What Gangistas would?
It would be interesting, re the swap vs fixed comparative table above, if TD rates offered by each bank, on the same 2-year basis, were also compared between 2015 and 2022. Please supply.
yes ANZ 5yr mortgage 5.6%, 5yr TD 3.2% !!!! Last time round 5.6 was paired with about 4.2.
Spoke to a guy I know who is a RE agent in Auckland, not happy at all! Looks like the sound of champagne bottles popping and the smell of new car interiors may be coming to an end for at least some up there. Things will get cut throat pretty fast.
Agents may soon have to do the unthinkable and opt for a Japanese-made car. Oh the inhumanity of it all.
A double whammy when you consider the price of fuel at the moment. Awfully expensive to drive the Audi S8 to all the empty open homes.
Nevermind having to downgrade to even cheaper suits
How can you downgrade from TaroCash?
The answer is so obvious.
does the wharewhero sell suits?
Lol… I quite like the old TaroCash slim fit
Every cloud has a silver lining. I'm in the market for another Euro vehicle so could be in for a bargain.
Does anyone out there know how the Auckland housing market is currently going. My daughter was looking at a bigger home for her family but was beaten by someone from Auckland who needs to sell their home first. They offered over $300k more to get the vendor to sign. The agent said there was an element of fomo in the offer. My daughter and her husband were disappointed but have moved on as it really is a first world problem when you compare it to living in the Ukraine for example. An agent or two think the vendor will be coming back to her as the current purchaser might find it hard to sell in the current market.
Latest from spruikers "rising interest rates only result in higher house prices"
The swap rate curve is going about as vertical as house prices were a few years ago.
Every action has an equal and opposite reaction... so the incline in interest rates = decline in house prices :)
Many specufestors have decided that they do not want to know about swap rate curves.
Mortgage rates will soon be stepping in the same zone as personal loans (starting from a little over 6%: https://www.banked.co.nz/personal-loans).
I know lenders anticipate increasing rates and factor it into their decision to lend or not, but even so, there will be lots of people struggling to pay their mortgages in the coming years.
Still can't see it having much of an impact on house prices though
We welcome your comments below. If you are not already registered, please register to comment
Remember we welcome robust, respectful and insightful debate. We don't welcome abusive or defamatory comments and will de-register those repeatedly making such comments. Our current comment policy is here.