

Summary of key points: -
- New Zealand’s economy relative to Australia; What it means for the NZD/AUD cross-rate
- Financial markets start to rethink the Fed’s next move with interest rates
New Zealanders, rightfully or wrongfully, are constantly comparing themselves to their cousins across the Tasman Sea. Whether it is sporting prowess, incomes, house prices or retirement savings, us Kiwis hold something of an obsession that the grass is always greener in the much larger economy next door. Many New Zealand companies and individuals have found out the hard way that often that is not the case. Markets, unionisation, distances and consumer preferences can be very different in Australia. While Australia may be labelled the “lucky country” with extensive mineral resources and wealth, we compete very well with them on many other relative economic measures.
The dramatic 13% “straight line down” depreciation of the NZ dollar against the Aussie dollar over the last 11 months since August last year has surprised many with the speed and extent of the currency realignment. The recalibration of the NZ dollar value relative to Australia’s has been entirely due to the Reserve Bank of New Zealand (“RBNZ”) deciding last November that the NZ economy required major monetary policy stimulus and they cut the OCR interest rate to 2.25%.
In complete contrast, the Reserve Bank of Australia (“RBA”) determined (only three months later) that their inflation rate was not under control and too far above their 2.50% target, therefore they hiked interest rates three times in early 2026 from 3.60% to 4.35%.
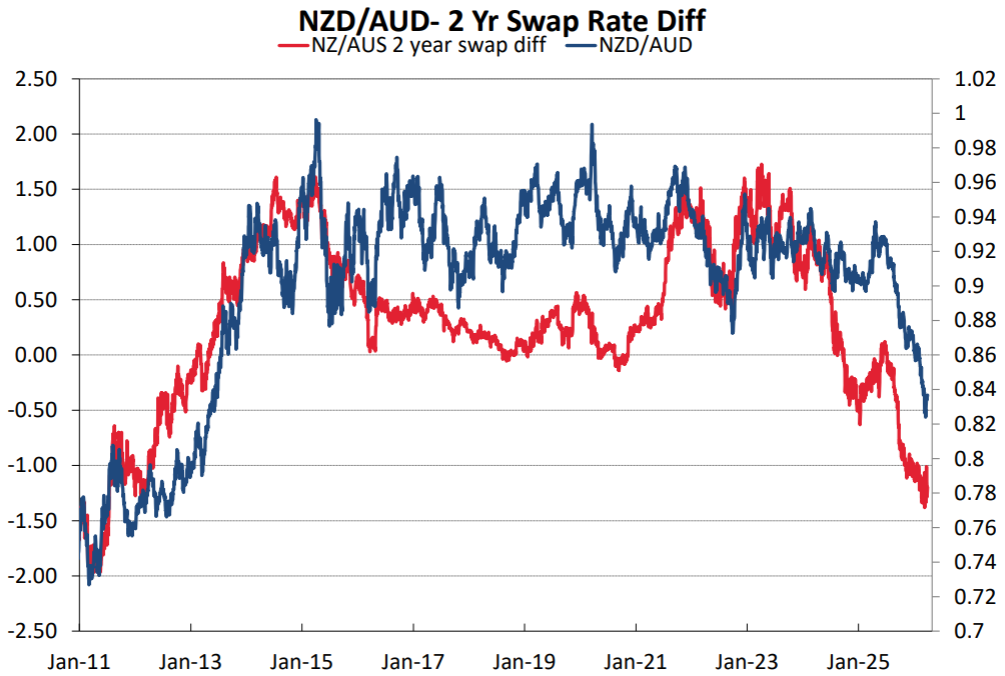
The sudden divergence in monetary policy stances and settings propelled our two-year swap interest rates from being above those of Australia to more than 1.00% below Australian two-year swap rates (refer to the interest rate differential chart below).
Currency speculators around the globe switched to “long AUD” positioning against the USD (as Australian interest rates went above the US), however retained “short sold” NZD positions (as NZ interest rates remained well below those of the US). The AUD appreciated, the Kiwi did not.
The above is a description of why the NZD/AUD cross-rate is at 0.8220 today. However, what most are interested in is where the NZD/AUD cross-rate will move to over the next six to 12 months. At the end of the day, the movements of the NZD/AUD cross-rate are always a function of how the NZD moves against the US dollar, relative to how the AUD moves against the US dollar. It is a “relative” relationship, therefore any forecast ahead for the NZD/AUD cross-rate must analyse all the relative components that determine the exchange rate direction.
- Relative monetary policies and interest rates
Current short-term interest rate market forward pricing has three x 0.25% increases from the RBNZ over the next 12 months to 3.00%, whereas over recent weeks the Australian pricing has dramatically shifted from two x 0.25% hikes to no change over the next 12 months. If the New Zealand increases come about, it still leaves the NZ OCR at 3.00% well below the Australian OCR at 4.35%. However, what is important for the NZD/AUD exchange rate is the relative movements of the respective two-year swap interest rates that build-in future expected OCR changes. As the Australian economy slows and inflation risks abate, the Australian two-year swap rate can be expected to decrease from the current 4.35% level to somewhere approaching 3.50%. On the other hand, the New Zealand two-year swap rate at 3.40% currently will not move any lower and could easily increase when the RBNZ hike. The net result is the current 1.00% gap in the two-year swap rate closing up to zero over the next six months i.e. the red interest rate differential line in the chart above reversing back up to zero and driving the NZD/AUD cross-rate higher.
- Relative economic performance
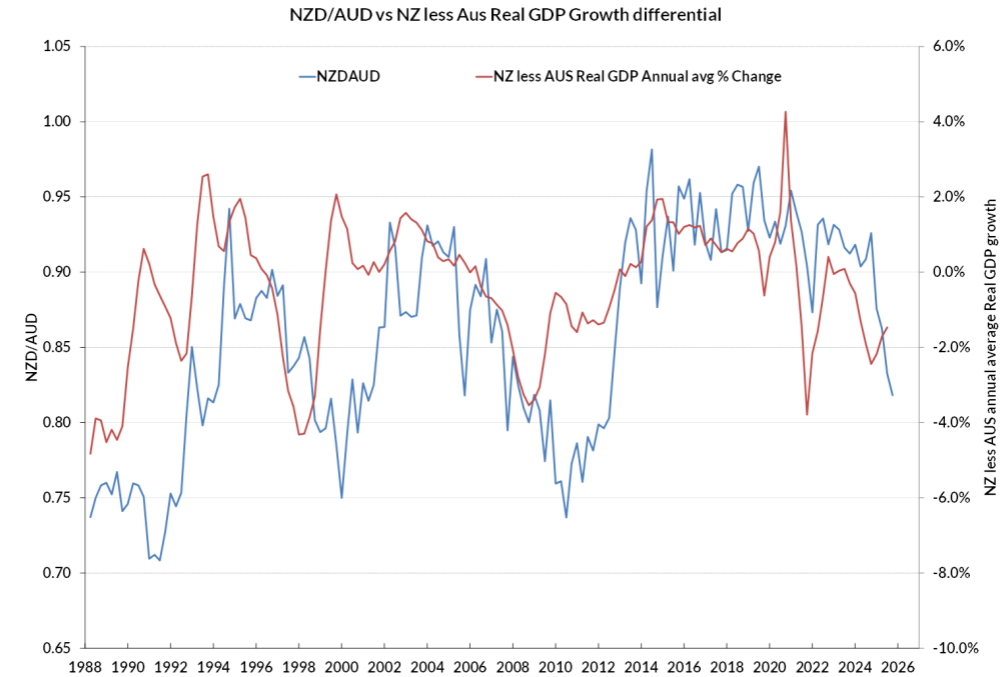
From 2014 to 2020 the “rock star” NZ economy outperformed the Australian economy (red line above 0% in the chart below). The NZD/AUD cross-rate lifted from below 0.8000 to above 0.9000 as a result. The post-Covid era has seen New Zealand underperform Australia as tight monetary policy, then years of household deleveraging, hit consumer demand, and we suffered several mini recessions (most of our own making!). However, the wheels are now turning in New Zealand’s favour again with the export boom over the last 12 months lifting GDP growth. In contrast, the Australian economy in the second half of 2026 and into 2027 will be slowing abruptly under tight monetary policy, falling house prices and lower immigration inflows. The red line in the chart below has already turned upwards, and it likely to move above 0% over the next 12 months.
- Relative export commodity prices
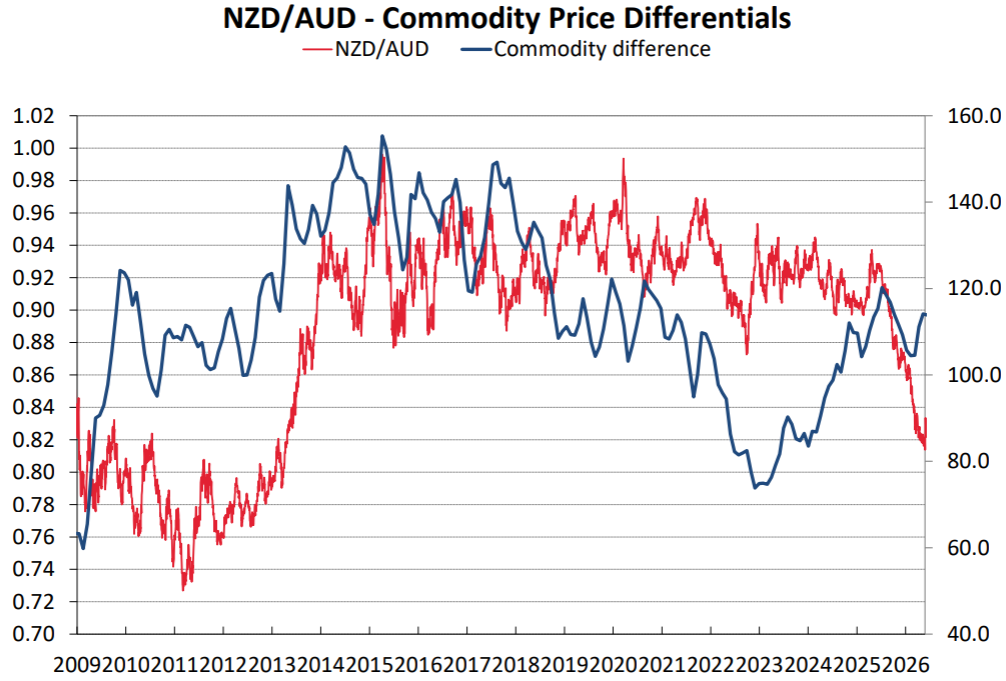
Interest rate differentials have dominated NZD and AUD currency movements over recent years and our respective export commodity prices, as reliable exchange rate determinants, have taken a back seat. However, as interest rates in New Zealand, Australia and the US all settle down into sustainable stability around the 3.50% region, the foreign exchange markets seem likely to return to relative commodity price performance as a differentiator for currency valuations and outlooks. Since 2023, our export commodity prices have outperformed Australian commodity prices, rising whole milk powder dairy prices against stable iron ore prices. The improving trend for New Zealand points to a higher NZD/AUD cross-rate, not a lower one.
- Relative currency market speculative positioning
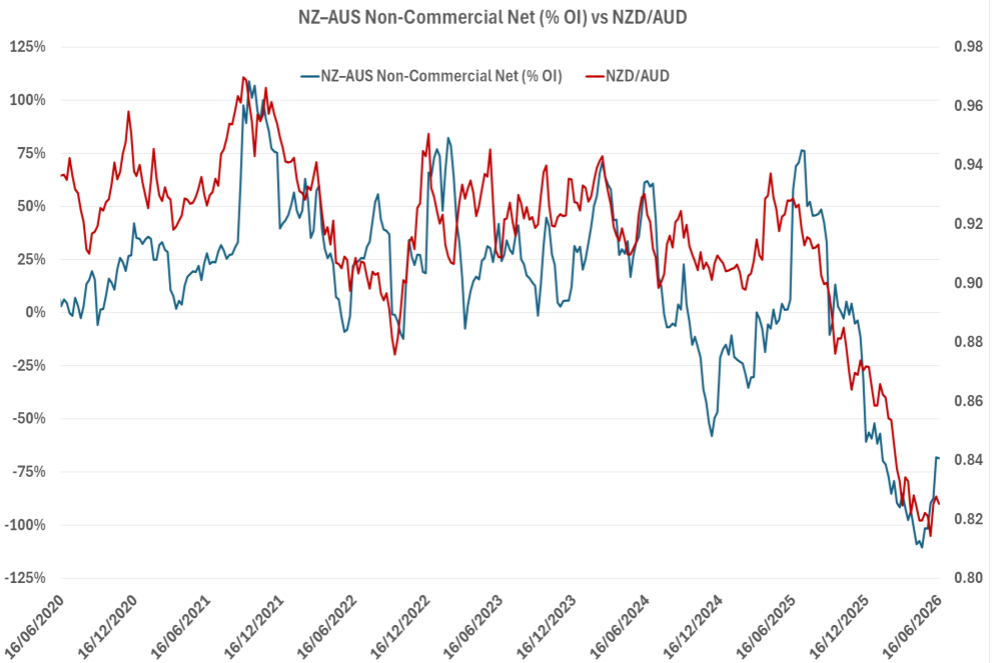
There is no denying that changes to speculative positioning levels in foreign exchange markets have a direct bearing on short-term currency market movements. Our column has tracked both NZD and AUD speculative positioning against the US dollar for many years. The recent surge higher in the Australian dollar from 0.6400 against the USD to 0.7200 was largely due to Australian interest rates suddenly moving above those of the US and the currency punters instantaneously switching from “short sold AUD” positions to “long AUD” positions as they received the forward points (interest rate difference) to do so. The chart below combines the NZD and AUD speculative positioning against the USD into a ‘NZ-AUS Non-Commercial Net” i.e. speculative NZD versus AUD positioning (blue line in the chart). The correlation with NZD/AUD movements over the years is relatively close. The NZD versus AUD net positioning has reversed upwards over recent weeks as “long AUD” positions have reduced, and “short sold NZD” positions have also reduced. On this evidence, a pullback to 0.8400 in the NZD/AUD cross-rate looks to be on the cards.
- Relative productivity trends
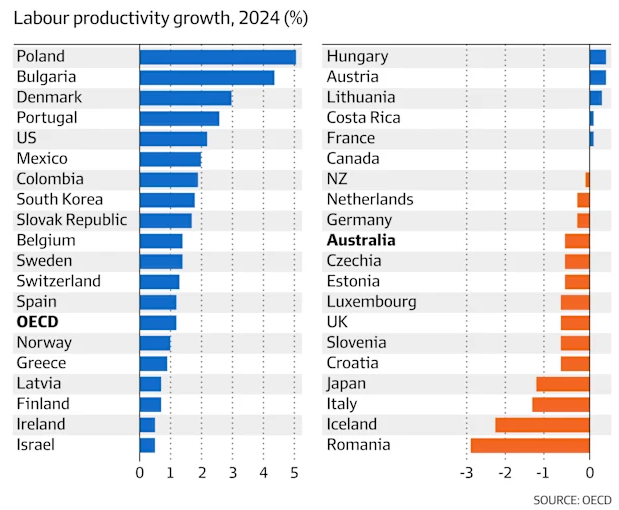
Whilst everyman and his dog lament our poor productivity performance in New Zealand (due to too many people employed in non-productive retail jobs), according to the somewhat dated OECD labour productivity comparative data below, we still manage to outpoint the Aussies! Smart use of capital and technology can only improve New Zealand’s productivity rating going forward. There are some very good signs of that finally happening in our manufacturing and food processing industries. It would surprise many that labour productivity is higher in New Zealand than Australia.
Financial markets start to rethink the Fed’s next move with interest rates
Over the past 18 months the US dollar has appreciated on the currency market’s reaction to numerous “risk events”, namely; Trump’s tariffs in early 2205, the Trump instigated Iran/US war this year and Kevin Warsh’s first meeting as Chairman of the US Federal Reserve last month. After the ending of the first two risk events, the US dollar gains could not be sustained as US economic data pointed to a weaker economy and lower inflation (resultant lower US interest rates being negative for the US dollar).
In the post Iran/US war era with plummeting oil prices, the FX markets are now in something of a quandary as to whether US interest rates are going to increase because of Kevin Warsh’s prime commitment to get annual inflation back to 2.00%, or are US interest rates going to decrease under the weight of softer employment data and a rapid fall in the inflation rate?
Two weeks ago, the foreign exchange markets concluded that Kevin Warsh had signalled a “hawkish pivot” to raising interest rates to bring inflation down. The USD Dixy Index increased from 98.00 to 101.40 as the speculators placed bets that the Fed would hike interest rates. Today, the markets are starting to have second thoughts as to the probability of the Fed actually hiking. It always comes back to how the US economic data prints relative to prior forecasts and what the overall trends are. Last Thursday, the June Non-Farm Payrolls employment numbers were considerably weaker than forecast. The US dollar has already corrected back to 100.62 as the previous bullish bets on the USD going higher are starting to unwind. The increase in the number of new jobs in the month of June was 57,000, well down on the 110,000 expected. In addition, as has become the norm over the last 18 months, job increases initially reported for previous months were revised downwards. April and May increases were adjusted down by 74,000 to +148,000 and +129,000 respectively. Yet again there was no employment growth in the major industries of energy, construction, manufacturing, wholesale and retail trade, transport, financial services and government. How some of the members of the Fed can call the labour market as “robust” is beyond belief. The unemployment rate reduced a fraction from 4.30% to 4.20%, however not from increased employment, but from more people leaving the workforce i.e. not even bothering to look for a job, as they do not exist. In the Household survey of employment that is conducted alongside the Non-Farm Payrolls (survey of business firms), the total employed number reduced by 507,000. The labour participation rate has dropped to 61.50% its lowest levels since March 2021. Conditions in the US economy are not as good as many perceive who just look to the rising equity markets (including President Trump in that group).
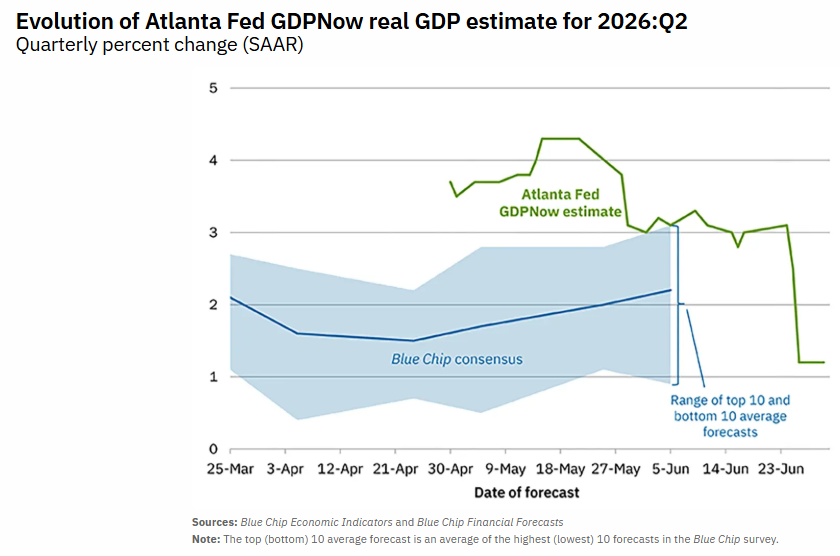
It will need a stream of weaker US economic data releases to fully convince the FX and interest rate markets that the next move by the Fed with interest rates will be a cut, not a hike. We expect that scenario of softer data to play out and the US dollar to further retreat right back to 98.00. The Federal Reserve Bank of Atlanta produce a GDPNow estimate of US economic growth for the June quarter, it has recently been slashed to just a +1.20% annual rate of growth. The GDPNow tracker for GDP growth (green line in the chart below) would not have decreased so sharply if the leading indicators in the economy had been stable or improving, they are clearly weaker.
The actual GDP growth figures will be released on Friday 31st July and a sharp fall from the annual growth rate of 2.10% for the March quarter has to be expected. It should be sufficient evidence to doubting Fed members that demand in the US economy is not strong and inflation is not at risk of increasing. Indeed, it will decrease dramatically over coming months on the significantly lower oil, energy and gasoline prices. Important US economic data releases before then include June inflation on 14th July and Retail Sales on 16th July.
As the AI boom in US equity markets starts to wobble, it would not be surprising to see global equity investors reducing their risk exposures to both equities and the US dollar and take their spectacular gains of recent months back home. It does appear to us that the economic negatives for the US dollar will outweigh any risk event positives for the currency value, without ever knowing when such new risk events will raise their head.
Daily exchange rates
Select chart tabs
*Roger J Kerr is Executive Chairman of Barrington Treasury Services NZ Limited. He has written commentaries on the NZ dollar since 1981.
1 Comments
From my experience ( I traded this cross all last year) it won’t happen until the cash rate physically moves. The interest rate futures market last year had the cash rate differential priced for almost the whole year yet the cross never really moved until we eventually moved to what was the expected spread. My theory behind this is that the carry traders actually pick up the carry in the forwards which is usually out to 3-6 months rather than further out as shown in your chart ( 2 year swap). So until you are actually paid to turn you don’t. I thought it would have been more sophisticated than this but appears not. Example: I use CME futures and when I rolled from the June contract to the Sep contract I picked up about 50 currency points. ( I look at the cross in terms of AUDNZD) so it’s proper carry cash for the trader.
We welcome your comments below. If you are not already registered, please register to comment
Remember we welcome robust, respectful and insightful debate. We don't welcome abusive or defamatory comments and will de-register those repeatedly making such comments. Our current comment policy is here.