

Summary of key points: -
- August: often a negative month for the Kiwi dollar
- Weaker US employment numbers, but no selling of the US dollar (yet!)
- The weak Australian dollar hurting households, but not the Federal Government
August: often a negative month for the Kiwi dollar
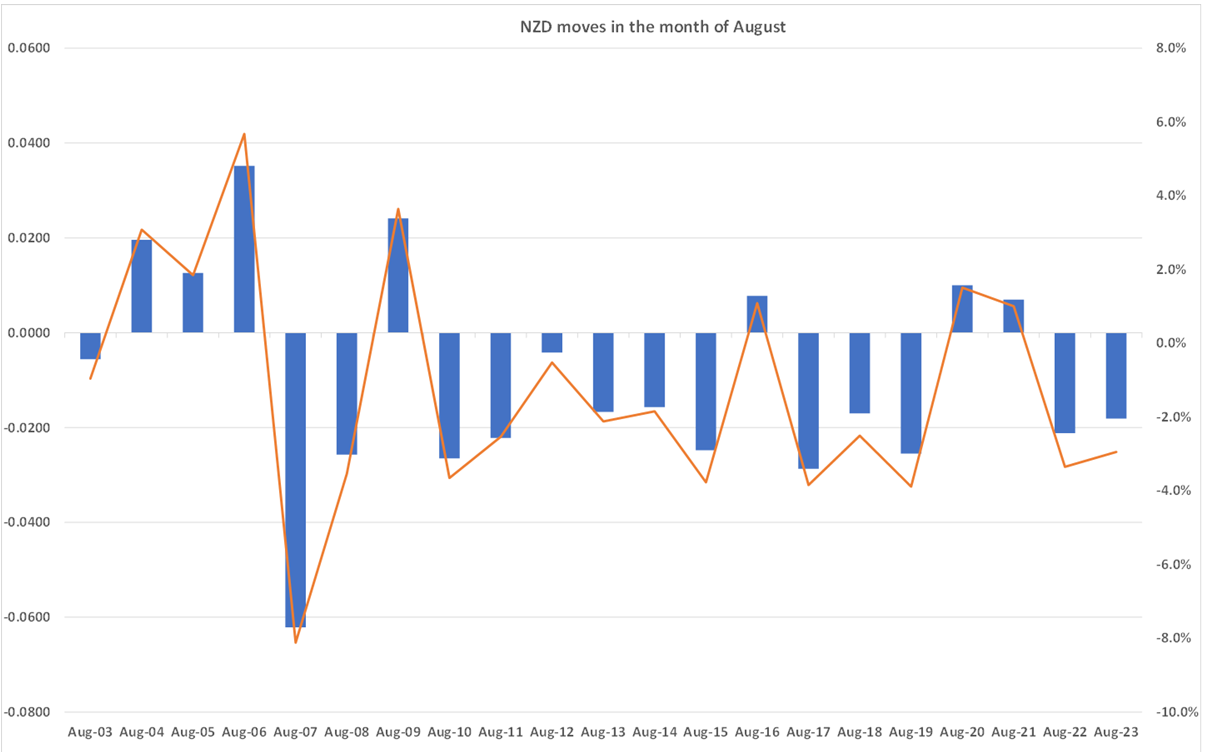
The NZ dollar depreciated 1.8 cents over the recently completed month of August, from 0.6130 at the start of August 2023 to 0.5950 on 31 August 2023. The Kiwi dollar’s currency value falling away during the month of August has been a consistent and repeated patten for many years.
The chart below confirms that the NZ dollar has only been able to appreciate upwards on three occasions in August over the last 14 years. Typically, the NZD decreases by 1.5 to 2.0 cents against the USD over the month. The small NZD gains in August 2020 and August 2021 were due the US money printing (their initial response to the Covid pandemic) and the value of the US dollar going down against all currencies at that time. A similar analysis for the movements of the NZD/USD over the months of September, October and November displays a quite different pattern, with gains and losses for the Kiwi dollar over these months much more evenly balanced.
So, what is it about the Kiwi dollar and the month of August?
The natural explanation as to why the NZ dollar is nearly always sold over the month of August is that US and European investment bankers and hedge fund managers all go on their summer holidays in August, therefore they reduce their speculative currency positions, especially in a minor currency like the Kiwi dollar. The absence of these currency market players from the market reduces overall NZD/USD forex market liquidity, leading to an exaggeration of daily movements in response to economic data releases or events. However, lower market liquidity alone does not really explain why the NZD is nearly always sold in the month of August.
The northern hemisphere summer holiday period typically leads to more volatility in global equity markets due the thinner volumes being traded. Equity markets do not appear to make the consistent gains in August due to the absence of many participants. Therefore, the propensity for the hedge funds to enter new “risk-on” currency trades buying the NZD and AUD due to rising equity markets, is much reduced. Participants in the NZ dollar currency market from Australia and Asia also reduce their interest levels in August due to the US and Europe being on holiday.
Locally, the winter month of August is very much the “off-season” for our major primary producer commodity exporters (buyers of Kiwi dollars) and it is a time when the big importers of retail goods (sellers of Kiwi dollars) start to ramp up forward hedging for their increased Christmas trade volumes. Not that local import/export trade FX flows are necessarily material enough to make a difference on daily NZD/USD rate movements, however at times they can influence the price “on the margin”.
The NZD/USD exchange rate has had two of three forays back upwards to 0.6000 over the last two weeks, however it has not been able to sustain the gains and has returned each time to the 0.5950 level. On the other hand, the Kiwi has held firm above 0.5900 as the AUD/USD rate has held above 0.6400. Investor risk sentiment in US equity markets is expected to improve from now until the end of the year as the investors gain confidence from US interest rates going no higher and the risk of the US economy declining into recession being much reduced.
Weaker US employment numbers, but no selling of the US dollar (yet!)
There were positives and negatives for the financial/investment markets in the US Non-farm Payrolls jobs numbers released last Friday 1st September. The number of new jobs in the US economy over the month of August at 187,000 was marginally above prior consensus forecasts of +170,000 to +180,000. However, there were significant revisions downwards (100,000 jobs) in the earlier released June and July jobs numbers. The employment data confirmed a clear softening in labour market conditions (as we have been expecting) and should change the views of the Federal Reserve FOMC voting members who have been stating that the labour market is still “robust” and thus a threat to inflation.
The unemployment rate jumped up to 3.80% from 3.50%. However, that was not due to massive worker lay-offs, but due to more people looking for work with the participation rate increasing to 62.80% from 62.60%. Basically, the thousands of Americans who took the Covid benefit cheques and went “off-grid” for a prolonged period without working for a living, have now run out of cash, and are back looking for a job.
On the wages front, the average hourly earnings for August at 4.30% (year-on-year percentage) was lower than July and consensus forecasts of 4.40%. The dramatic decline in the US headline CPI inflation rate from 9.00% to 3.00% over the last 12 months confirms that the US does not have the “wage-push” inflation problem that New Zealand and Australia have.
The US dollar value did initially fall on the softer Non-farm payrolls data, as it provided further evidence that the Fed will be pushing the “pause” button on interest rate hikes at their next meeting on 20 September. However, later the same day, US ISM Manufacturing survey data for August was better than expected at 47.60, compared to forecasts of 47.00. In a mixed picture, employment and pricing intentions were stronger in the ISM survey, however new forward orders were lower at 46.80 (compared to 47.3 in July and expectations of a 48.00 result). The increase in crude oil prices over the last two months from US$70/b to US$86/b would have influenced the pricing intentions upwards. The Fed will not be concerned at that increase as they manage monetary policy on “core inflation” which excludes volatile food and energy prices.
The USD Dixy Index retuned to 104.25 at the market close on Friday following the ISM data after declining to below 103.00 earlier in the week. US economic data over coming weeks in the lead up to the Fed’s meeting is expected to print on the weaker side (e.g. ISM services this week, CPI inflation figures 13 September and retail sales 14 September). It has to be expected that both US 10-year bond yields (currently 4.18%) and the USD Currency Index will decrease significantly when the Fed deliver the official confirmation that interest rates are going no higher. The markets will start to price that confirmation in ahead of the Fed’s 20 September meeting.
We continue to see a weaker USD from here, allowing an NZD/USD recovery to above 0.6000.
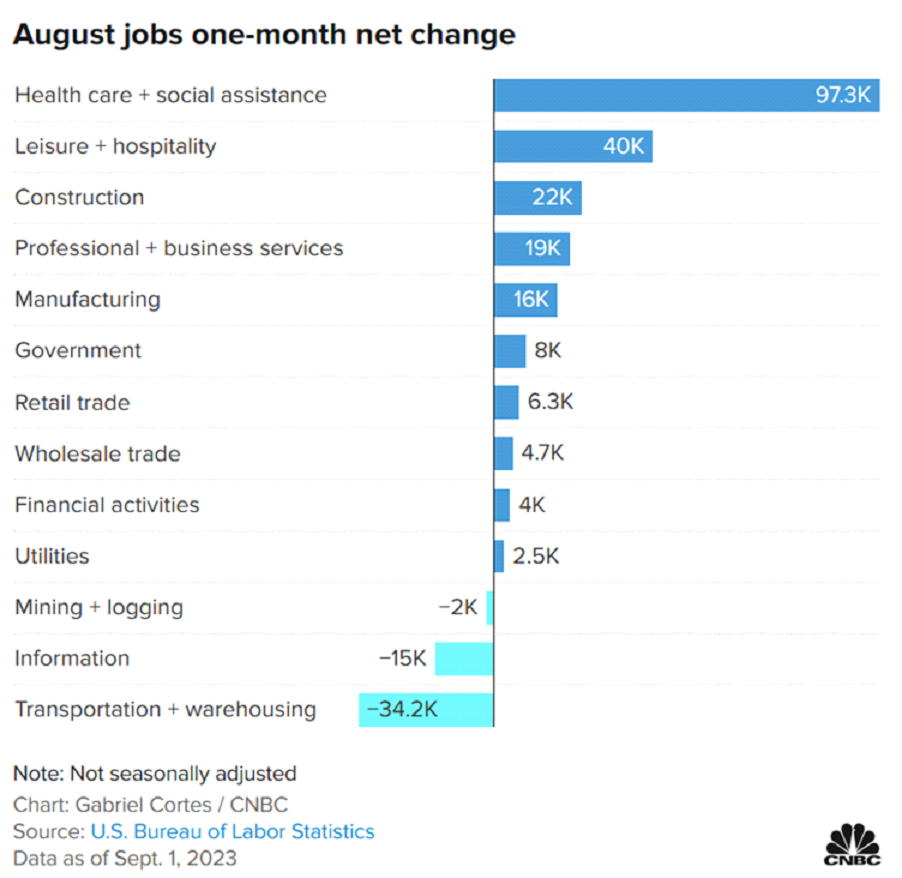
The chart below of the US August jobs by industry sector, yet again confirms that it is only the healthcare sector that is increasing employment. The number of healthcare workers is already back to pre-Covid levels; therefore it is unlikely that there will be a continuation of the strong increases over coming months. It all adds up to weaker US employment numbers over the rest of 2023.
The weak Australian dollar hurting households, but not the Federal Government
Do not anticipate any change in position or stance from the Reserve Bank of Australia (“RBA”) at their meeting this Tuesday 5th September. Outgoing RBA Governor, Philip Lowe sees no need to get inflation down to the 2.50% target until 2025. Incoming Governor, Michele Bullock is expected to express a different view when she is in the seat for the next meeting on Tuesday 3rd October. The FX markets have to be anticipating a more hawkish tone from Ms Bullock, which is supportive of the AUD.
The weak AUD exchange rate to the USD at 0.6450 is highly unusual compared to historical cycles, given that Australia’s terms of trade index (export prices against import prices) is currently at record highs with metal/mining export prices in AUD terms at record highs. The AUD has departed from their commodity prices because the RBA have not increased their interest rates as much as most other countries. In adopting a monetary policy that depreciates the AUD, the RBA are punishing households with higher imported inflation and hindering business investment in imported capital equipment as the fixed asset cost is too high and the return on investment does not stack up.
The winner form the low AUD/high commodity price situation is the Aussie Federal Government, as they receive gigantic royalty payments from the mining industry. These payments to the Aussie Government are now so large that the Treasurer, Jim Chalmers will announce this month the Government’s surplus for the 2022/2023 year will be closer to A$20 billion, against a forecast of A$4 billion made in his budget in May. Seems to be a bad misplacement of priorities and policies.
Daily exchange rates
Select chart tabs
*Roger J Kerr is Executive Chairman of Barrington Treasury Services NZ Limited. He has written commentaries on the NZ dollar since 1981.
We welcome your comments below. If you are not already registered, please register to comment
Remember we welcome robust, respectful and insightful debate. We don't welcome abusive or defamatory comments and will de-register those repeatedly making such comments. Our current comment policy is here.