

- US bond market worries about inflation should start to abate
- US employment – what measure do you believe?
Changes in the overall value of the US dollar against the major world currencies (as measured by the USD Dixy Currency Index) drive changes in the NZD/USD exchange rate. Over the last two years the NZD side of the NZD/USD exchange rate equation has had extraordinarily little influence on the direction. Over the next nine months it is unlikely that the New Zealand economy and interest rates will change very much to influence the value of the NZ dollar. The change will continue to come from the US economy, US interest rates and therefore the US dollar. For this reason, our analysis on what has happened and projections forward on what is likely to happen, concentrates almost entirely on developments in the US economy.
The markets that every day measure the performance of the US economy and reflect the trends and expected future trends are the equity, bond and currency markets. Currently the US equity markets are totally dominated by the stocks that are benefitting from the AI and semi-conductor revolution. As a result, the equity markets have become somewhat divorced from the influence of long-term bond yields through the company valuation formulas. The equity markets also seem distanced from trends in the US economy that in the end determine listed company profits and growth. Since the start of 2024 US 10-year bond yields have increased from 3.90% to 4.20%, which would normally be negative for equity markets. However, the Dow Jones Index has increased by 5.60% over that three-month period.
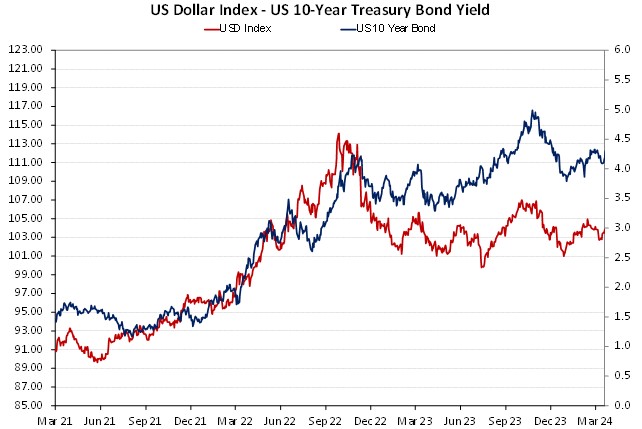
Movements in the US 10-year Treasury Bond yield however are continuing to have a major influence over the US dollar value. The last three months have seen mood and sentiment swings up and down in the bond market as the day-to-day pricing reflects whether the bond market participants are gaining or losing confidence that the Federal Reserve will cut interest rates three times this year starting in June. The bond yields react to stronger or weaker than anticipated economic data and the USD Index follows the bond yields higher and lower. Typically, foreign exchange markets are very forward looking and price into today’s exchange rate what is expected to happen in the future. However, due to the Federal Reserve now setting monetary policy based almost entirely on historical actual US inflation and employment data, the FX markets have also become backward looking. The Fed’s current stance is not to reduce interest rates and change monetary policy setting from tight to neutral until actual CPI inflation has reached their 2.00% target. They are not quite there yet but are only a few months away, as the shelter (rents and housing costs) component continues to decline in its 12-month lagged fashion.
It does seem that both the Fed and the bond market do not yet have total confidence that the annual CPI inflation rate will decrease from its current 3.20% to somewhere near 2.00% by June to allow the Fed cut interest rates. The annual CPI inflation rate will not fall when the March figures are released on 10 April as the March 2023 increase was a low 0.10%. The April result in mid-May is likely to see significant shift downwards in the annual rate as the high 0.40% increase in April 2023 drops out of the annual figures. However, the Fed prefer the PCE Price Index as a more accurate measure of inflation. The February PCE index data was released on Easter Friday, recording an increase of 0.30%, marginally below the prior consensus forecast of +0.40%. The annual PCE Index is already at 2.50% and will also only move lower when the April numbers are out in mid-May.
It is recognised by the Fed and the markets that US consumer prices always increase by more in the months of January and February than any other month of the year. Annual price increases in the services sector are behind this pattern. Seasonal adjustments to the inflation data are meant to smooth out such occurrence, however that is proving to be somewhat ineffective.
It should be expected that the US 10-year bond yields will recommence their downtrend from the 5.00% highs of October 2023 and move well below 4.00% over coming weeks/months as they become more comfortable that the decline in inflation is not stalling and the Fed will be cutting interest rates in June. A return of bond yields to the 3.50% region, which prevailed over the first half of 2023, would see the highly correlated USD Index lower to near 100.00 (currently 104.27 – refer to chart below). A depreciation in the USD Index to 100.00 would allow the NZD/USD rate to return to 0.6300 (currently 0.5985).
US employment – what measure do you believe?
The increase in US bond yields and the USD Index this year have largely been due to much stronger than anticipated Non-Farm Payrolls jobs data. December and January employment increases were well above 300,000 each, however they have subsequently been revised substantially lower. In a speech in San Francisco last Friday, Fed Chair Jerome Powell stated: “The fact that the US economy is growing at such a solid pace, the fact that the labour market is still very, very strong, gives us the chance to just be a little more confident about inflation coming down before we take the important step of cutting rates.” In other words, there is still a risk that the robust labour market could cause wage increases that stalls the decline in inflation.
However, is Chair Powell correct when he states the labour market is “still very, very strong”?
The answer depends on what measure of employment in the US you believe.
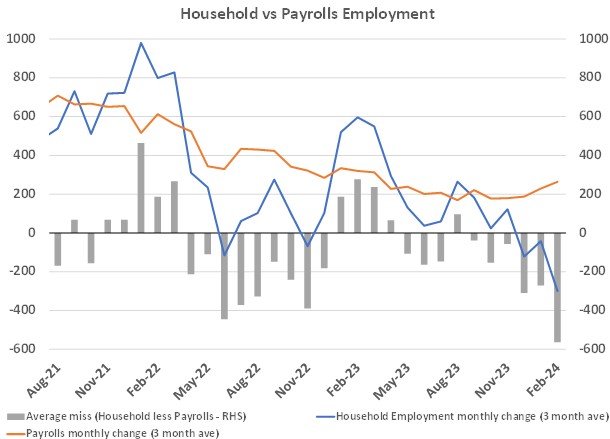
The chart below confirms the increase in jobs over recent months as measured by the Non-Farm Payrolls series (orange line). Chair Powell is citing this measure with his comments above. The Non-Farm Payrolls statistic is a survey of businesses, asking them how many workers they have hired and fired over the last month.
The second measure of employment is the Household Survey, where individuals are asked whether they are in employment or not (blue line on chart). Since October last year the number of Americans in employment has plummeted from +200,000 to -300,000 according to the Household measure. The exact opposite trend to the Non-Farm Payrolls results. The grey bars in the chart measure the difference between the two employment measures. Whilst the Household series is more volatile, it tends to more accurately foreshadow a pending decline in the Non-Farm Payroll measure. (e.g. June to December 2022). The contradictory employment data does point to upcoming Non-Farm Payroll results over the months of March, April and May declining to monthly increases below +200,000. The Non-Farm Payroll measure relies on modelling that determines the number of jobs added from new start-up businesses and the number of jobs lost through businesses going bankrupt. It has been proven that this modelling is inaccurate at turning points in the economy. In an economic slowdown, the model underestimates the jobs being lost and overestimates the jobs being added.
The next Non-Farm Payrolls employment data for the month of March is on Friday 5th April. Do not be surprised to see a result below the +200,000 consensus forecast and again revisions downwards in previous months. Two or three months of weaker than expected jobs numbers will cause Chair Powell to shift away from his “very, very strong” description. Such results will also force US bond yields lower and the USD Currency Index lower. Watch this space…
Daily exchange rates
Select chart tabs
*Roger J Kerr is Executive Chairman of Barrington Treasury Services NZ Limited. He has written commentaries on the NZ dollar since 1981.
3 Comments
Thank you Roger Kerr for the excellent analysis.
These are the weightings for the US index:
Euro (EUR) 57.6% weight
Japanese yen (JPY) 13.6% weight
Pound sterling (GBP) 11.9% weight
Canadian dollar (CAD) 9.1% weight
Swedish krona (SEK) 4.2% weight
Swiss franc (CHF) 3.6% weight
Some 65.4% are European and if you include GBP, then 77.3% impacts the US index.
If you chart the euro against the US index, it is almost the same. The outlook for Europe is grim, with Germany in recession and Ukraine about to erupt again as Russia targets Odessa/Transnista as they enter the summer fighting season. With a weak euro, the US index will remain strong and therefore, due to the NZD/USD-US index correlation, a weaker NZD looms/is already happening.
We welcome your comments below. If you are not already registered, please register to comment
Remember we welcome robust, respectful and insightful debate. We don't welcome abusive or defamatory comments and will de-register those repeatedly making such comments. Our current comment policy is here.