

Summary of key points: -
- Major reset by US interest rate markets seems inevitable
- Technical charts and economic fundamentals turn positive for the Kiwi dollar
- Positives and negatives for the Australian dollar
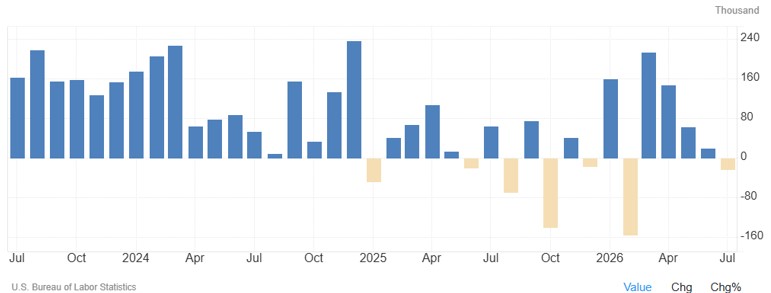
Bets by the US interest rate markets and calls by several Fed members and the majority of economic/market commentators in the US over recent weeks have been that the Fed needs to increase interest rates because inflation is not coming down and the employment market remains “robust”. Judging by the latest economic evidence, both the markets and the commentators have got this completely wrong. If the interest rate markets and the commentators have got this right, the US dollar would be appreciating in value. It is not, the US dollar has depreciated on the weaker than expected GDP growth data two weeks ago and the much softer than expected Non-Farm Payrolls employment data released last Friday night. The US economy shed 23,000 jobs in the month of July, a much more negative outcome than the +80,000 estimated by prior consensus market forecasts. Unsurprisingly, previous months’ jobs increases in May and June were retrospectively revised downwards by very large amounts. The originally announced +172,000 figure for May was revised lower to just +63,000 and the originally announced +57,000 for June was revised lower to +20,000. The significant historical revisions make a mockery of the accuracy and trustworthiness of the data, and that is why new Fed Chair, Kevin Warsh has a task force to review the key economic measures used by the Federal Reserve in respect to their timeliness and accuracy. We have highlighted this problem with the Non-Farm Payroll jobs data for some time now. The reality is that the labour market in the US has cooled dramatically over the last 18 months, as the first chart below confirms. There is no way the Fed will be convinced to tighten monetary policy with interest rate increases when employment is weakening and wage increases are trending downwards.
The decrease in Non-Farm Payroll jobs in July came as no surprise to us, the accompanying household survey of employment has been very weak for several months now and it typically leads the Non-Farm Payroll jobs survey of business firms. The second chart below from Westpac, annualises the six months jobs data for both measures, confirming the material drop in US employment.
US Non-Farm Payrolls – Monthly change over the last three years
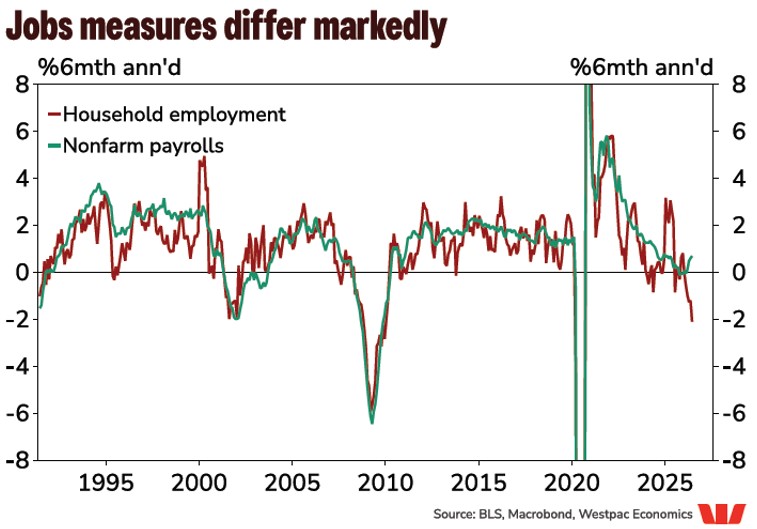
Lower oil prices as the conflict in the Middle East bumps along to a compromised end, coupled with further evidence of all other prices in the US economy trending downwards (not upwards, as so many commentators erroneously pontificate about!) and the weaker than forecast employment data - all add up to a major reset coming in the US interest rate markets. When the two-year and 10-year US Treasury Bond yields reverse back down by the 0.60% they have increased by over the last six months, the US dollar should fall further out of favour. The interest rate markets will also price-out any expectations of future Fed rate hikes and that is also clearly negative for the US dollar.
The next signpost for the interest rate and FX markets will be the US CPI inflation numbers for the month of July being released on Wednesday August 12th. Headline inflation is forecast to be a flat 0.00% for the month, decreasing the annual headline rate of inflation from 3.50% to 3.40%. Core inflation for July is expected to increase by 0.20%, reducing the annual core rate from 2.60% to 2.50%. Inflation is trending downwards towards the Fed target of 2.00%. Yet again, it is difficult to see where the evidence is of increasing inflation risks are to justify Fed hikes that the markets have seemed so convinced about.
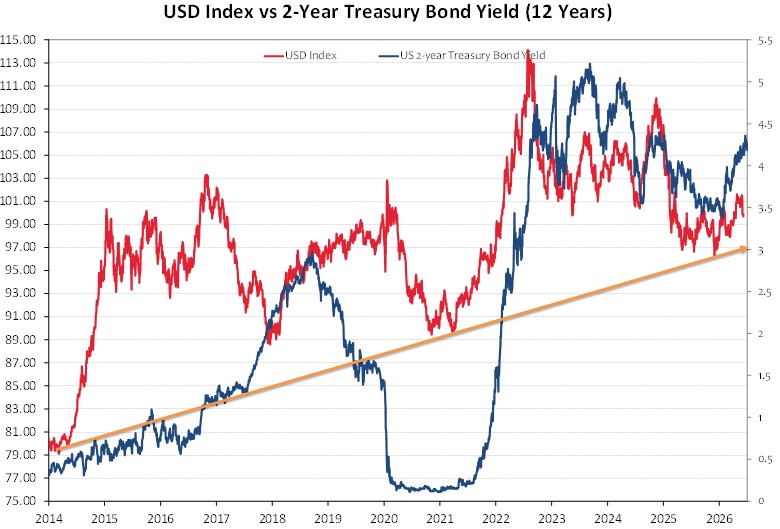
The dominant influence over the NZD/USD exchange rate is how the US dollar itself is moving against the major global currencies (as measured by the USD Dixy Currency Index). The USD Index has pulled back from a high of 101.40 on 28th July to 99.48 today. A full reversal of the 0.60% increase this year in the US two-year Treasury Bond yield from 3.60% to 4.20%, would stand to push the USD Dixy Index further lower to the key long-term support level at 97.00 (refer to the chart below that demonstrates the correlation between the USD Dixy Index and US interest rates). A return of the USD Dixy Index to 97.00 would propel the NZD/USD exchange rate higher by 1.50 cents to 0.6050 from the current 0.5900 spot rate.
Technical charts and economic fundamentals turn positive for the Kiwi dollar
It has been an up and down see-saw for the NZD/USD exchange rate over the last 18 months, oscillating between 0.5550 and 0.6100. The chart below records the NZD/USD moving averages against the spot rate. When the spot rate (blue line) moves sharply higher, climbing up through the 30-day moving average (green line) and 90-day moving average (red line), provided the conditions are ripe with a weaker USD trend, the Kiwi has made significant gains, in April 2025 and January 2026.
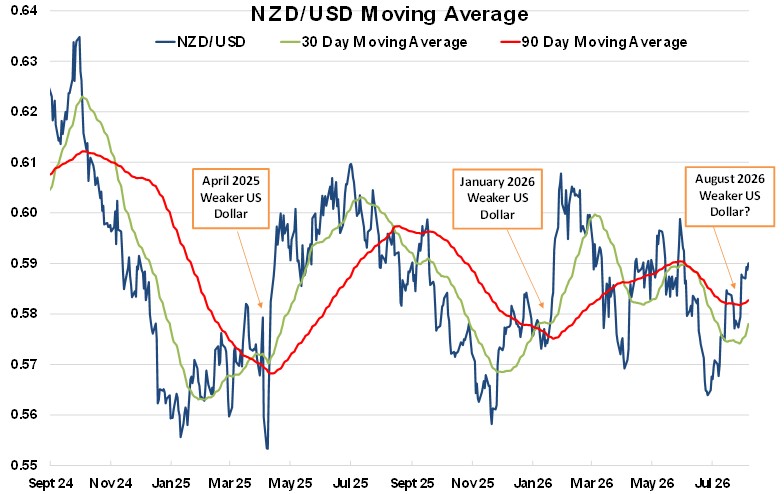
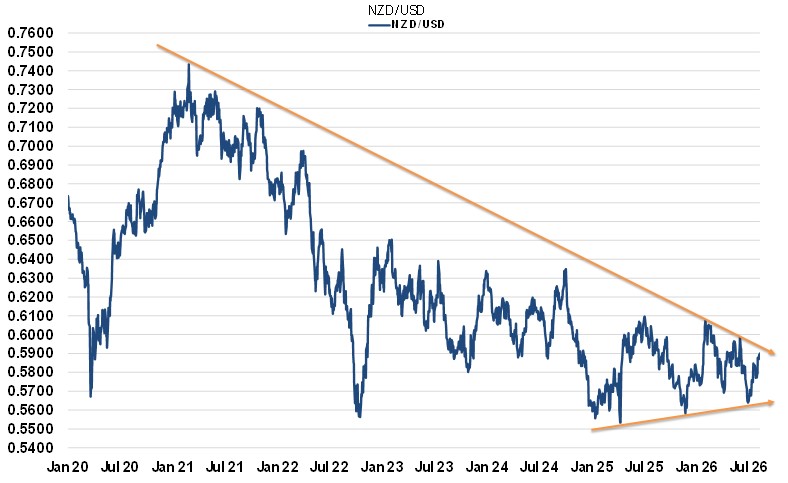
Today, we again have an appreciating NZD/USD spot rate, which has again recently reversed quickly out of a short-term plunge lower to 0.5630 and has now climbed up to 0.5900. We also have a weaker US dollar environment that suggest continuing NZD gains as the patterns repeat. The technical/chart related picture does look more positive for the Kiwi dollar with the lows over the last 18 months becoming higher each time, however the highs becoming lower at the 0.6100 and 0.6000 region. Continued NZD appreciation to above 0.6100 over coming weeks/months would certainly be a major break-out of the top side of the trading range that has held since late 2024.
The NZD/USD exchange rate currently at 0.5900 is also close to key chart/technical level of 0.5920, a break above that level could attract further Kiwi dollar buying. A movement above 0.5920 breaks out to the topside of the long-standing five-year downtrend line (refer to the chart below).
As well as the technical situation for the Kiwi dollar looking more positive, the underlying fundamentals for the New Zealand economy are also very much on the improve. Last week we included a chart that confirmed the rebound in business confidence and how that had diverged from the NZD/USD exchange rate movements, which for other reasons related to negative interest rate differentials, had been stuck in the 0.5550 to 0.6100 range.
The strong recovery in New Zealand’s GDP growth is now being more widely recognised. Higher export volumes and prices have been driving the growth for 18 months now. However, as the growth has not come from higher immigration and rising house prices, it has taken a long time for it to be understood and recognised. The RBNZ’s GDP growth Nowcast forecast model, that measures all the component parts of GDP, is currently estimating +0.20% growth for the June quarter and +0.90% for the September quarter.
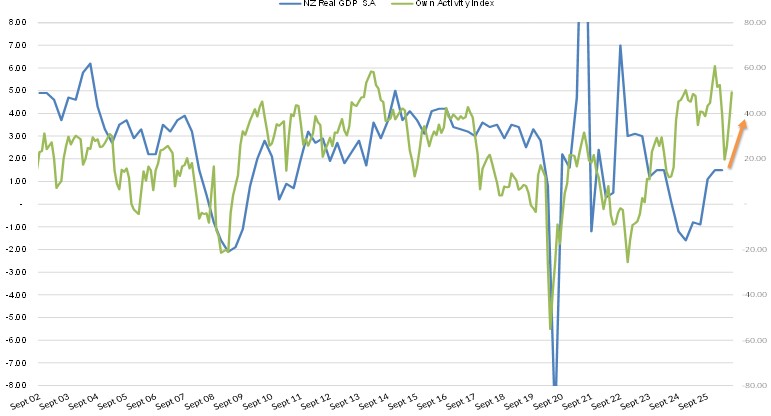
The annual GDP growth rate in the chart below (blue line) is moving upwards again, following the “Own Activity” index (green line) from the monthly ANZ business confidence survey. When the own activity index has been above +4.00% in the past (2013 to 2018), GDP growth has lifted to well above +3.00% pa. There is no question that the NZ economy has come through the uncertainty of the energy crisis much better than most expected. Confidence has returned and the economy is expanding at a faster clip than comparable economies in 2026.
Positives and negatives for the Australian dollar
The Reserve Bank of Australia (“RBA”) meet this Tuesday to decide whether a further OCR interest rate increase is warranted on top of the three increases this year to 4.35%. Stronger employment data through June and July support the case for another hike as wage increases continue at higher levels (particularly in the public sector). On the other hand, the CPI inflation results for the June quarter was well below the RBA’s and the market’s forecasts, suggesting that the already tighter monetary conditions are doing their job and limiting price increases. On balance, we do not think the RBA will hike on Tuesday, citing a preference to wait and see the impact on the economy of the earlier interest rate increases. However, should the RBA choose a last hike to make sure they have cut off inflation, it would be a positive surprise for the AUD.
It would not necessarily be negative for the Australian dollar if the RBA held steady. Australian interest rates remain above those of the US and if the US dollar continues to weaken as US interest rates reverse back downwards, the AUD will be moving up alongside other major currencies.
Whilst a slowing economy on falling house prices and lower immigration would justify the RBA ending its monetary tightening cycle, it does not automatically mean the appreciation of the Aussie dollar has come to an end. The AUD/USD exchange rate, along with the Norwegian Krone, has been the best performing currency against the USD over the last five months of the Iran/US war and volatile oil prices.
The AI boom and the building of data centres globally has seen a massive increase in demand for copper. Copper prices have soared and that is good news for Australia as a copper exporter. It is also good news for the Australian dollar currency value. Australian currency forecasters are now adjusting their AUD/USD rate forecasts higher as they factor in the positive tail winds from copper prices and a weaker US dollar.
It does look like the “lucky country” will yet again be saved from a domestic economic recession by a buoyant resources sector. A return to more positive growth in the Asian economies post the Iran/US war is also a positive for the Australian economy and the AUD exchange rate.
Daily exchange rates
Select chart tabs
*Roger J Kerr is Executive Chairman of Barrington Treasury Services NZ Limited. He has written commentaries on the NZ dollar since 1981.
We welcome your comments below. If you are not already registered, please register to comment
Remember we welcome robust, respectful and insightful debate. We don't welcome abusive or defamatory comments and will de-register those repeatedly making such comments. Our current comment policy is here.