

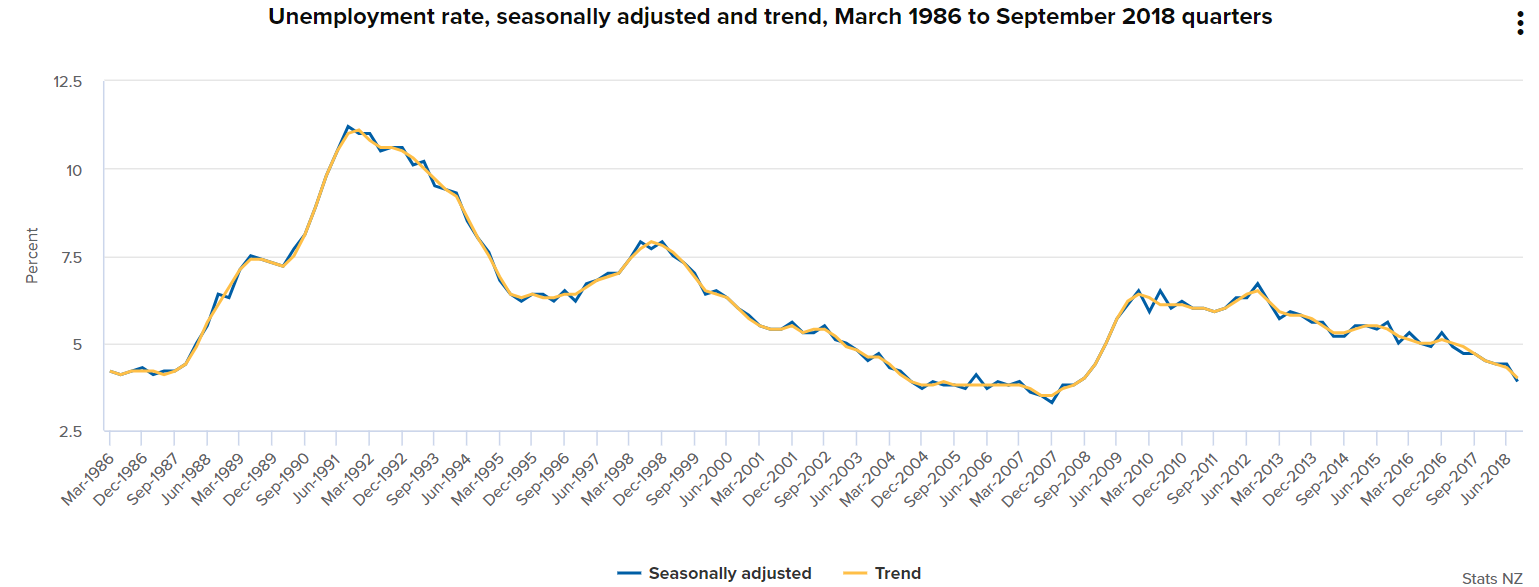
New Zealand now has its lowest unemployment rate in over 10 years and highest employment rate since Statistics New Zealand began the current employment series 30 years ago.
The New Zealand dollar shot up by about three-quarters of an American cent to hit US67.4c - its highest level since early August.
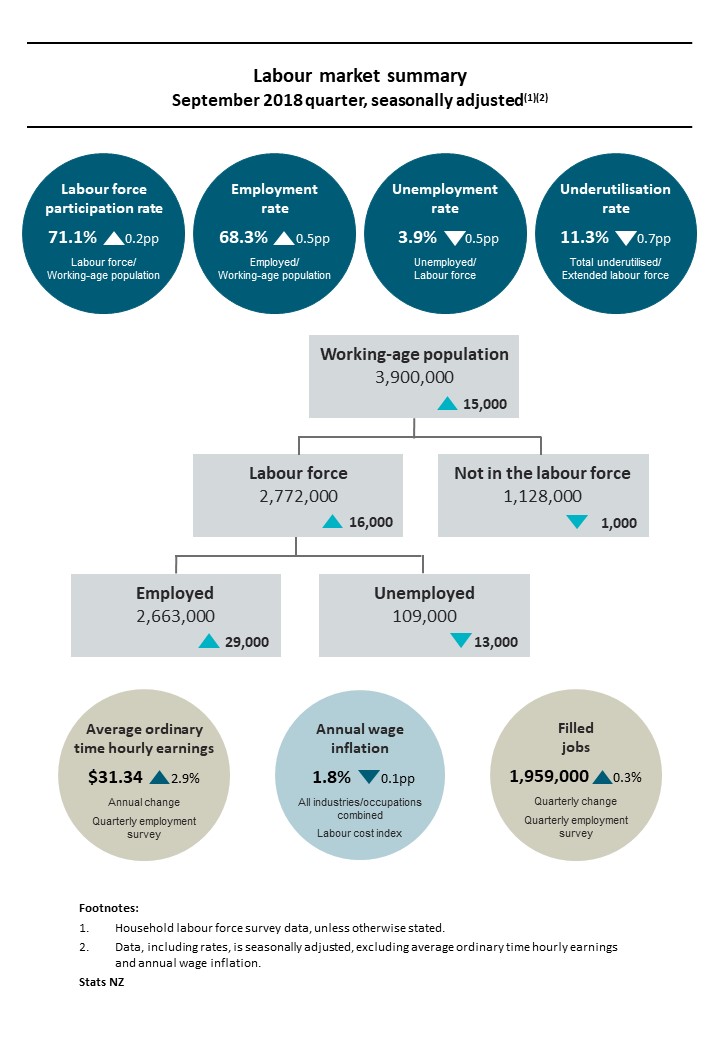
According to Stats NZ as of the September quarter the unemployment rate plummeted to 3.9% from a revised 4.4% in the June quarter.
The fall was completely unexpected by economists, who had generally been forecasting a figure of about 4.5% and inevitably there will be questions as to whether this is a 'rogue' result, though Stats NZ has immediately defended the voracity of the data, saying they are "confident" of the result and by stating that large changes in the rate - both up and down - have occurred before, while labour market figures tend to lag other economic indicators.
The falling unemployment and rising employment - with the rate gaining to 68.3% - if taken at face value give lie to the falling business confidence survey results that have been seen since this Coalition Government came in late last year. The 'participation rate' including all those actively seeking work rose to 71.1%, which is also a record.
Wage growth remained subdued, with private sector wages climbing just 0.5% in the quarter and 1.9% for the year.
ANZ senior economist Liz Kendall said Wednesday's data "were undeniably" strong and give the Reserve Bank - which has its next review of interest rates on Thursday - more breathing room to see how developments unfold.
"The tone of the RBNZ’s press release may reflect this strength tomorrow, although the RBNZ may also be wary of noise in the data.
"On balance, today’s data are a more consistent with a stick-to-the-script tone than a more dovish outcome, although the projections themselves will already be finalised and the RBNZ will, as always, emphasise the medium-term outlook and risks. We remain comfortable with our call that the OCR will remain on hold, but today’s data reaffirms that there are risks on both sides of the ledger. Waiting and watching developments remains a prudent approach."
Kiwibank chief economist Jarrod Kerr and senior economist Jeremy Couchman say the labour market data was "decidedly strong" and "the third in a trifecta of glamour statistics we economists love the most", with the other two having been strong GDP figures and higher inflation figures.
"The purple patch of cool Kiwi data takes the risk of an [Official Cash Rate] cut off the table. The screws have tightened a little further on the RBNZ’s decidedly dovish view. A view they are likely to defend for now at least. The RBNZ is meeting its labour market mandate to support “…maximum levels of sustainable employment”. This leaves the Bank focused on inflation. Inflation is coming, and wage growth is ready to play its part," they say.
They believe the next OCR move by the RBNZ will be a hike, and one that is delivered around May 2020 – six months or so earlier than the Bank is currently signalling.
BNZ head of research Stephen Toplis said he did not expect to see the RBNZ's statement on Thursday to look much different to the last interest rate review.
"We also accept that the Household Labour Force data probably slightly overstate the true tightness in the labour market. Nonetheless, they are yet further evidence that this economy is operating at or above potential and that, as a result, there must be a very real risk that inflation rises to, and stays above, the mid-point of the RBNZ’s target mid-point.
"Furthermore, RBNZ policy is about aiding sustainable growth and employment. Allowing things to get too tight risks the need for an aggressive policy response that could create unnecessary volatility in both output and employment.
"We don’t expect the RBNZ to change its main message tomorrow but the odds of it being forced to a tightening bias by February next year are certainly rising."
ASB senior economist Mark Smith expects that wage inflation will progressively firm from late 2019, with the OCR starting to move up from 2020.
"This expectation is conditional on the economy retaining sufficient momentum to push inflation higher. On the basis of today’s figures the hurdle to an OCR cut has certainly increased. Plenty can happen between now and then and the RBNZ will want to see concrete evidence of firming inflation before lifting the OCR. This looks to be 2020."
This is the release from Statistics New Zealand:
The seasonally adjusted unemployment rate fell to 3.9% in the September 2018 quarter, Stats NZ said today.
This is down from 4.4% last quarter and is the lowest unemployment rate since the June 2008 quarter, when it was 3.8%.
The fall in the unemployment rate in the latest quarter reflected a fall in the number of unemployed people (down 13,000) and a strong rise in employment (up 29,000). This quarter’s employment rate rose to 68.3%, the highest rate since the series began more than 30 years ago.
The fall in unemployment, in tandem with a fall in underemployment, was key to the underutilisation rate falling to 11.3%.
“While this quarter’s unemployment rate is outside market expectations, we know New Zealand has a small economy with a dynamic labour market, and large changes, both up and down, have happened before – in late 2012 and 2015,” labour market and household statistics senior manager Jason Attewell said.“We also know labour market measures tend to lag behind other economic indicators, which have shown strong and widespread growth in 2018. We’ve seen population growth in the regions, reports of more job ads, high levels of migration and tourism, growing retail sales, and rising exports.”
“Labour market data is most valuable when placed in the context of a time series. The trend series, which reveals the underlying direction of movement, has now fallen for seven consecutive quarters,” Mr Attewell said.
The likelihood that someone would move out of unemployment, from one quarter to the next, rose in the September 2018 quarter when compared with previous September quarters.
A tight labour market can lead to low unemployment – when demand for workers increases to the point where people who are not in the labour force, or are unemployed, secure employment almost immediately on wanting a job.
In the latest quarter, 109,000 people were unemployed – 13,000 (10.5%) fewer than in the June 2018 quarter, with 8,000 fewer women and 5,000 fewer men. For both sexes, this mainly reflected 11,000 fewer unemployed youth (15–24-year-olds).
There were 6,000 fewer youth unemployed and not in education, which led to the not in employment, education or training (NEET) rate falling to 10.1 percent. The fall in NEET youth was primarily influenced by men and women aged 20–24 years.
There were also:
- 5,000 fewer youth who were unemployed and in education
- 7,000 more youth in education and employment
- 5,000 more youth in education and not in the labour force.
In the year to the September 2018 quarter, 73,200 (unadjusted) more people, as measured by the household labour force survey (HLFS), were employed (up 2.8%) – 45,200 more women and 28,000 more men.
These regions had significant employment growth:
- Auckland – up 34,600 (3.8%)
- Waikato – up 8,400 (3.3%)
- Otago – up 6,700 (5.5%)
- Gisborne/Hawke’s Bay – up 6,400 (6.5%)
- Taranaki – up 4,300 (7.1%).
Annually, filled jobs, as measured by the quarterly employment survey (QES), increased 1.2% (unadjusted) – 23,500 more jobs. Of this increase, 17,500 were held by women and 6,000 by men.
Differences between filled jobs in the QES and employment numbers in the HLFS can largely be explained by differences in survey coverage. The QES excludes some industries (including agriculture), and those who are self-employed without employees (to better fit international standards). Conversely, the HLFS only includes usually resident New Zealanders, so can exclude some temporary seasonal labourers.
The labour cost index (LCI) increased 1.8% in the year to the September 2018 quarter, while the analytical unadjusted LCI increased 3.3%. Private sector wages increased 1.9%, while public sector wages increased 1.5%.Within the QES, wages also grew annually. Average ordinary time hourly earnings increased to $31.34 (up 2.9%). Private sector average ordinary time hourly earnings increased 3.6%, to $29.38, while for the public sector the increase was 1.6%, to $39.31.
Average weekly earnings (including overtime) for full-time equivalent employees (FTEs) also increased annually, up 3.3% to $1,212.82 per week.
Weekly earnings
Select chart tabs
Unemployment
Select chart tabs
We welcome your comments below. If you are not already registered, please register to comment
Remember we welcome robust, respectful and insightful debate. We don't welcome abusive or defamatory comments and will de-register those repeatedly making such comments. Our current comment policy is here.