

- The USD is poised to break its shackles and depreciate on softer US jobs and inflation
- Rapid shift in Japanese Yen value on the cards
- Copper prices are again a key barometer
The USD is poised to break its shackles and depreciate on softer US jobs and inflation
A recurring theme in the global currency markets (and recurring in this FX markets commentary report as well!) over the last five months has been constant up and down movements in the US dollar, with, however, the overall value of the USD remaining within a defined trading range.
The USD Dixy Index has fluctuated between 101 and 105 since early February, resulting in the NZD/USD exchange rate remaining between 0.6050 on the bottom and 0.6350 on the top. To date, there has not been any significant local economic event (negative or positive) to drive the Kiwi dollar on its own accord below 0.6050 or push it higher above 0.6350. The NZD/USD exchange rate continues to be totally determined by US dollar movements in response to trends in US economic data.
The zig-zag pattern in the forex markets since February has unfolded as follows: -
- An appreciating USD value (lower NZD/USD rate) as the US financial markets respond to generally stronger than expected US employment data being released each month. The market’s response and rationale being that the majority of Federal Reserve members continue to see a “robust” labour market as a risk to preventing inflation coming down (i.e. tight employment conditions pushing up wages). Whilst the labour market remains strong, in their view, the Fed must continue raising interest rates until the employment conditions are better balanced between supply and demand.
- A depreciating USD value (higher NZD/USD rate) as the US financial markets respond to generally lower than expected inflation results. The speed at which the US annual headline inflation rate has plummeted from a peak of 9.00% in June last year to the current 4.00% has surprised most. The FX markets have generally sold the USD lower when the monthly actual inflation results have come out lower than consensus forecasts. The rationale for a lower USD being that the Fed will be forced to pause from any further interest rate increases as they are winning the battle against inflation. Preventing the USD going any lower than 101 on the Dixy Index has been lingering concerns that the “core” inflation measure (excluding energy and food) might be a bit sticky around the 5.00% area as the services sector in the US has not really slowed up too much.
The USD appreciated on stronger employment data to 105 in early March, up to 104 in late May and above 103 in recent weeks.
The USD depreciated on softer inflation data to the 101 level in early February, mid-April and again in mid-May.
We may now finally be seeing a game-breaker development that is likely to disrupt this range-bound currency movement pattern over the last five months.
Last Friday’s US Non-Farm Payrolls jobs data for the month of June was an increase of 209,000 – lower than consensus forecasts and the lowest monthly figure since December 2000. The US dollar weakened from 102.75 to 101.90 following the jobs release, the Kiwi dollar lifting back above 0.6200.
Whether this is sufficient evidence to convince the Fed members who have continually labelled the labour market “robust” to date, to moderate their view, remains to be seen.
There was a marked reduction in new jobs in the leisure and hospitality sector which had been contributing to most of the higher-than-expected job increases over the first five months of 2023. Also pointing to a softer labour market outlook from here was the fact that April and May employment numbers were revised down by a combined 110,000 and there was a significant increase in part-time work – always a good indicator of a slowing employment market. The wholesale and retail trade sectors shed jobs.
Manufacturing and construction sectors were also subdued. Most of the June increase in jobs came from the health care and Government sectors. There is some evidence of US companies “hoarding” jobs i.e. retaining more staff than needed in the hope that activity will pick up soon. If activity does not improve, inevitably these companies will be laying workers off.
“One swallow doesn’t make a summer” with these latest US employment numbers, however if the softer trend continues the US dollar loses its largest pillar of support. The next US CPI inflation figures are released this Wednesday 12th July. Consensus forecasts are for a 0.20% increase over the month of June, which will drop the annual headline inflation rate from 4.00% to 3.20%.
Currently, the US interest rate markets are still pricing-in a greater than 90% chance of one last 0.25% interest rate increase by the Fed when they meet next on 26th July. The 90% probability may reduce significantly if the inflation figures are again below forecast this week.
In summary, the belated softening in US employment may well prove to be the catalyst that pushes the USD Dixy Index below its 101-support level over coming weeks and contemporaneously propels the NZD/USD exchange rate out of the top-end of its range at 0.6350.
Rapid shift in Japanese Yen value on the cards
New Zealand companies with Japanese Yen currency risks are strongly advised to be reviewing their hedged positions. There is a growing probability that the Bank of Japan will sometime in the next few months make their first change to monetary policy settings in more than 30 years. Rising inflation in Japan will convince the Bank of Japan to return to a normal monetary policy of positive interest rates, not the 0% or negative interest rates they have had for so long. The Japanese Yen weakened to near 145 last week as the currency markets reflected disappointment that the Bank of Japan are dragging the chain on the inevitable policy shift. However, the Yen appreciated sharply back from 145 to 142 later last week, and it would not be surprising to see a massive reversal of speculative positions over coming weeks/months that could take it all the way back to 130 Yen against the USD. One reason why Warren Buffett’s Berkshire Hathaway is buying into Japanese trading houses is that they regard the Yen as an undervalued currency, and these are great buying entry points.
The NZD/JPY cross-rate reached a high of 89.60 last week, however it is already down to 88.25. A projected 130 USD/JPY rate crossed with a 0.6350 NZD/USD rate generates a sharply lower NZD/JPY cross-rate of 82.55 – and that is very likely where we are headed.
Copper prices are again a key barometer
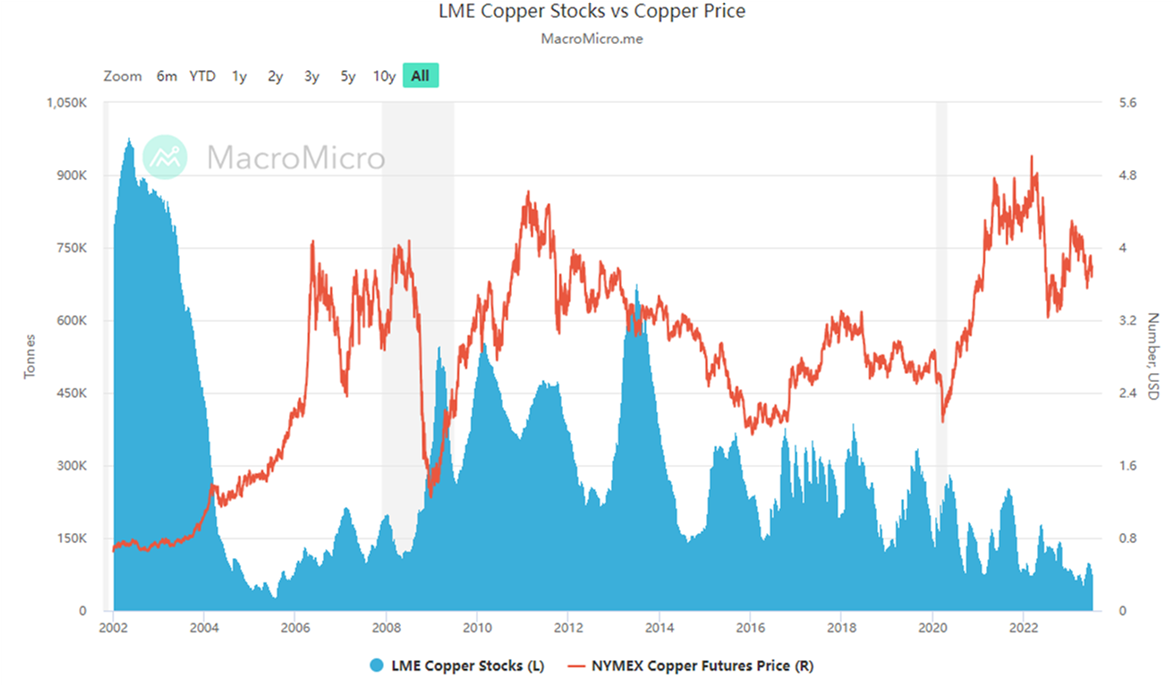
“Doctor Copper” is a term used in commodities markets to explain price trends in copper's ability to predict the overall health of an economy. Copper prices have traditionally held a strong correlation with global economic growth. Rising copper prices are an early barometer of improving economic activity as industrial demand outstrips supply. Alternatively, plunging copper prices are not good news for the economic outlook.
So, what are copper prices telling us right now? The copper price has decreased somewhat over the last 15 months after climbing to record highs in early 2022 when the Russian/Ukraine ware started. However, global copper inventory levels have recently plunged to their lowest levels since 2005 as mine disruptions impinge supply (refer chart below). Given the “electrification” of just about everything these days, the demand for copper is not exactly going to reduce. Copper prices seem poised for another major push higher, despite Chinese manufacturing/infrastructure demand not being what it once was.
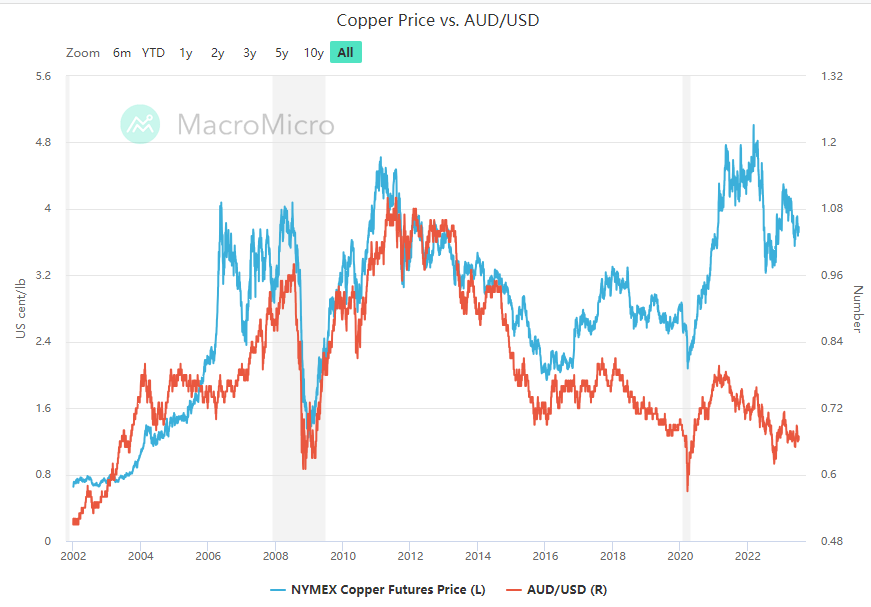
The Aussie dollar was reasonably correlated to copper prices up until two years ago when rising US interest rates and much lower Australian interest rates pushed the AUD/USD exchange rate in the opposite direction to copper prices. As US and Aussie interest rates become closer together over coming months, we could well see an appreciating AUD aligning itself once again with rising copper prices.
Daily exchange rates
Select chart tabs
*Roger J Kerr is Executive Chairman of Barrington Treasury Services NZ Limited. He has written commentaries on the NZ dollar since 1981.
We welcome your comments below. If you are not already registered, please register to comment
Remember we welcome robust, respectful and insightful debate. We don't welcome abusive or defamatory comments and will de-register those repeatedly making such comments. Our current comment policy is here.