
Summary of key points: -
- Overly-confident RBNZ focusing on wrong sources of inflation
- Overbought US dollar reverses sharply lower
- US housing market another important lead-indicator for the USD
Overly-confident RBNZ focusing on wrong sources of inflation
“Don’t worry, we have got this” was the overly-confident message from the RBNZ last week in terms of tackling the massive increase in New Zealand’s inflation rate.
The RBNZ are demanding respect and credibility in their handling of monetary policy to better align demand to lower supply levels in the economy.
The issue with credibility is that you must earn it, you cannot command it!
The clobbering of households/consumers with higher interest rates is their method to reduce demand.
The problem is that it is not excessive demand that has caused our 7% inflation rate.
The high inflation is the equally-weighted combination of imported oil/commodity sourced inflation (tradable, supply-side) and domestic home-grown sourced inflation (non-tradable, supply-side).
The RBNZ dismissed increased Government fiscal spending as a major source of the domestic inflation.
They are correct with that conclusion; thus the National Opposition MP’s are barking up the wrong tree in accusing the RBNZ of failing to blame the Government for this source of inflation.
As has been continuously demonstrated in this column, the permanent 3% per annum non-tradable inflation we are all paying for stems from our bloated bureaucracy passing on the cost of excessive Government legislation and regulation.
Local Government rates, building regulatory costs and education/health sector costs are the culprits and have been for many years.
The RBNZ have failed their inflation remit as they have not identified this source and taken successive Governments to task for their uncontrolled inflationary behaviour.
It could have been expected that the appointment of external members to the RBNZ’s Monetary Policy Committee may have brought some real-world, pragmaticism to identifying sources of inflation in the economy.
Worryingly, the three academics on the committee have seemingly not ever challenged or questioned RBNZ officials on this matter.
What is also concerning is that the RBNZ stated in their last statement that the depreciation of the NZ dollar to the low 0.6000’s was due to other countries increasing their interest rates and the interest rate gap to NZ closing up.
Interest rate differentials have not been a factor driving the NZD dollar direction for quite some time. We had no carry-trade funds parked in the NZ dollar to suddenly depart. The Kiwi dollar dived from 0.7000 to 0.6200 due to tumbling equity markets and the PBOC suddenly devaluing the Yuan which the NZD is linked to.
The RBNZ used to have their own specialist financial market executives monitoring the big buyers and sellers in the NZ dollar FX market and they would gather intelligence and insights on these currency forces. They do not seem to do this anymore.
The RBNZ also used the publish all the companies they had visited over the last three months to gain first-hand information on issues at the coalface of industries and the economy. That information has disappeared as well.
It is not the institution it used to be. What we get nowadays is an econometric model that spits out a result that the OCR will need to get to 3.90% to bring inflation back below the 3.00% maximum limit given current exchange rate and GDP levels. As we have seen over the last two weeks, the exchange rate can change rather quickly and therefore the model results become out of date.
Overbought US dollar reverses sharply lower
As US equity markets snap out of their longest weekly losing streak for decades, the tide also appears to be turning for the US dollar currency value.
The mighty US dollar, as measured by the USD Index (often referred to as the “Dixie” – a basket of only major six currencies against the USD, dominated by the EUR/USD at a 58% weighting) topped-out at 105.0 on 13 May as stocks on Wall Street tumbled.
Since then, as investor risk sentiment has recovered, the USD turnaround has been dramatic with the Dixie Index reversing back down to 101.6. The US dollar bulls in the forex markets are rapidly running out reasons as to why the USD should continue to appreciate.
Currency speculators who aggressively purchased the USD in April and early May on the back of a more aggressive Federal Reserve monetary policy and US inflation worries have been busy unwinding their long-USD positions over the last two weeks as evidence emerges that US inflation may have already peaked.
The first signal that the USD gains would not be sustainable came from the U-turn in direction in US Treasury Bond yields (as highlighted in last week’s report). The 10-year bond yields have continued to decrease over this last week to 2.74%. Foreign exchange markets continuously price-in to today’s exchange rate all future economic/financial market expectations.
Therefore, it cannot be too surprising that the US dollar has started to weaken against the Euro as European bond yields increase in anticipation of the upcoming ECB lifting of interest rates, whereas US bond yields are now falling as the Fed are well into their interest rate hiking cycle. It has been the long-held view of this column that the Europeans would be six months behind the US Federal Reserve in timing in respect to reversing loose monetary policy to a tightening cycle.
The ECB has been clearly signalling in recent weeks that they will be increasing their interest rates in July as they must deal to a 7.5% inflation rate, despite the economic clouds from the Ukraine/Russian war.
As previously stated, the monthly releases of US inflation data has now become the key economic lead-indicator for the US dollar’s direction.
The US annual inflation rate will now trend downwards as the big monthly price increases of 12 months’ ago drop out of the annual figures.
Last Friday’s second US inflation measure, the PCE price index for April (core index) increased by just 0.30% which was lower than the prior consensus forecasts of +0.50%.
The USD weakened as a result, the EUR/USD rate lifting to $1.0735. The next key inflation number in the US is the May CPI release on Friday 10th June. A significant decrease in the current 8.30% annual rate will be further evidence that US inflation has peaked and therefore be negative for the USD value.
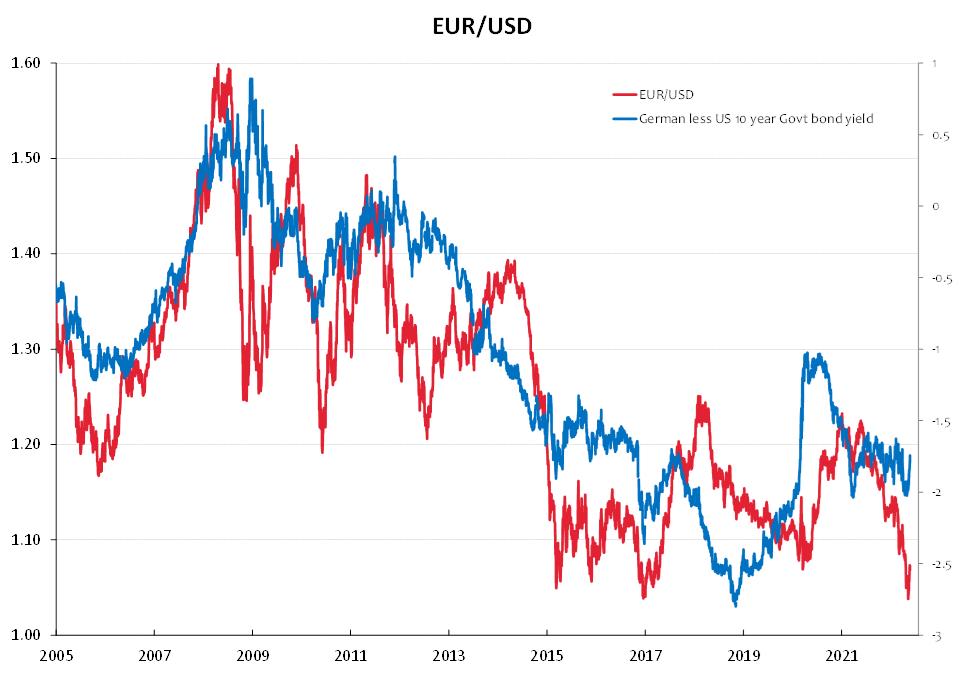
The chart below of the differential between US and German bond yields points to the EUR/USD exchange rate returning all the way to the previous $1.1500 to $1.2000 region.
A further 7% depreciation of the USD against the EUR to $1.1500 would result in the NZD/USD rate returning to 0.7000. Our view has been that the selling of the Kiwi dollar in April/May was short-term speculative in nature and would reverse back upwards just as rapidly as it dropped.
That anticipated “V” shaped recovery is already taking shape with the NZD/USD rate up to 0.6540 and there is a lot more to come as the USD currency buyers reverse their positions.
US housing market another important lead-indicator for the USD
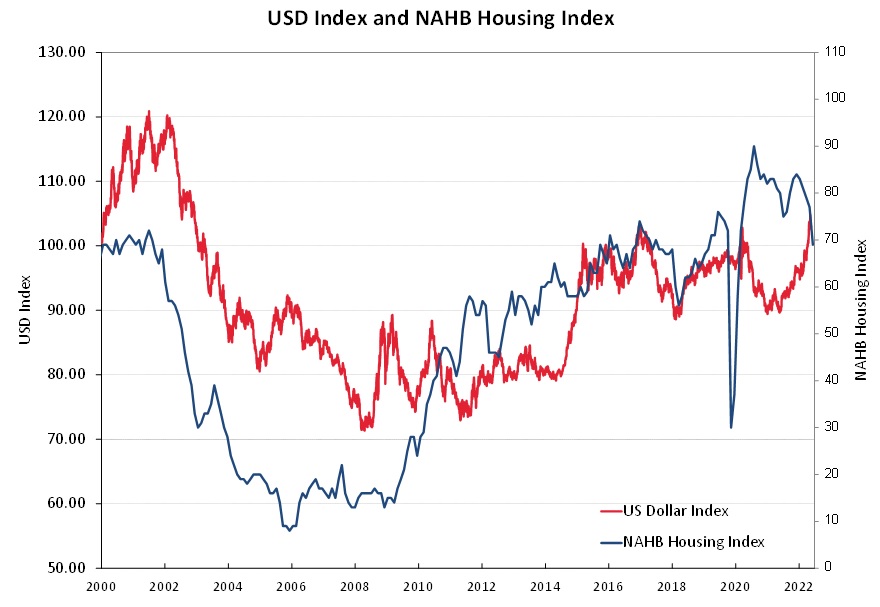
Whilst bond yield differentials suggest an over-valued US dollar, recent developments in the US residential real estate market point to a similar conclusion. US housing mortgages are priced-off their 30-year Treasury bond yield.
Mortgage interest rates have almost doubled from 2.9% to 5.5% over the last five months. Historical interest rate/housing confidence correlations would suggest that the NAHB Housing Index could decrease a lot further from 70 to near 40 (blue line in chart below).
Daily exchange rates
Select chart tabs
*Roger J Kerr is Executive Chairman of Barrington Treasury Services NZ Limited. He has written commentaries on the NZ dollar since 1981.
We welcome your comments below. If you are not already registered, please register to comment
Remember we welcome robust, respectful and insightful debate. We don't welcome abusive or defamatory comments and will de-register those repeatedly making such comments. Our current comment policy is here.