Understanding and playing the long game just as important for the domestic economy, as it is for USD exporters.
The domestic economy:
The reaction by some politicians and some members of the media last week to the Reserve Bank of New Zealand’s 0.25% cut of the Official Cash rate (“OCR”) to 3.25% was a classic indictment of the modern society we now live in where instant results and immediate gratification are always expected. The RBNZ has slashed the OCR by 2.25% from 5.50% in August last year to 3.25% today. The expectation of many was that easing of monetary policy would instantaneously produce higher growth in the economy, more jobs and more money in people’s pockets. The fact that the economy is not already expanding by 3.00% seems to have disappointed some and they cannot understand why the RBNZ have taken so long to adjust interest rates lower. The economists pushing for the RBNZ to cut the OCR interest rate to 2.50% in this cycle also seem to be suffering from the same impatience and short-termism. The RBNZ have reduced interest rates over the last 10 months at exactly the same pace they increased the OCR from 2.00% in June 2022 to 5.50% in June 2023. Inflation did not instantly collapse on those hikes, just as GDP growth is not surging today on the same pace of monetary policy adjustment the other way around. It takes time to work through, and “patience is a virtue” is not a concept that is well understood it seems.
“Good things take time” is the old adage your mother would have said, and for good reason. It takes nine to 12 months for change in interest rates to have a material impact on economic performance. Changes in human behaviour and transmission mechanisms in the economy take time to work through. The average household with a mortgage will not immediately go out and spend up large because of a miniscule decrease in their mortgage interest rate. The first deployment of any extra cash coming in, compared to the budget the household was operating under, is probably going to pay off the credit card balances built up when prices jumped up in the cost-of-living crisis. Likewise, mortgage borrowers in New Zealand predominantly fix their interest rates as generally the one and two fixed rates are considerably lower than the floating/variable interest rates on offer from the banks. Therefore, the benefit to the economy from OCR cuts always takes a prolonged period as the old, fixed rates roll-off and are replaced by new lower interest rates. The time lag is entirely mechanical.
Mortgage borrowers quickly work out that there is a financial “risk/reward” trade-off between fixing for a lower current interest cost and subsequently being fixed when market mortgage interest rates go below their fixed rate. They take the calculated risk that the former period will be longer than the latter period and therefore they are financially better off overall in the medium to longer term.
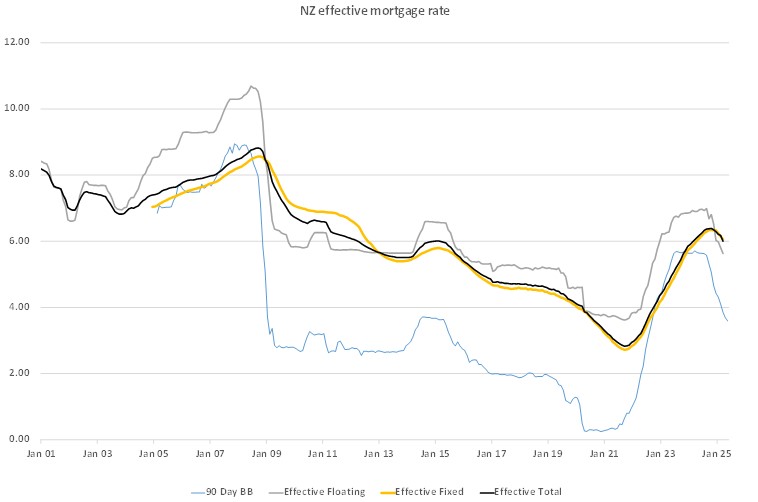
The chart below shows that total “effective” mortgage interest rate (fixed and floating combined together) being paid today across the economy is now only just starting to move below 6.00% (black line on the chart). The effective mortgage interest rate will fall sharply from the current 6.00% to nearer 4.50% over coming months, freeing up additional cash to either save or spend. Long suffering retailers will be hoping the extra cash in household’s hands will go to the latter!
Other factors come into play to impact household spending patterns, not just mortgage interest rates. Job security and residential property values are also big influences on confidence and consumer spending patterns. The slowdown in inwards immigration is certainly impacting property values in Auckland right now. The related slowdown in building/construction activity in Auckland has adversely impacted employment and therefore retail spending. The same negatives are not at play in regional New Zealand right now where incomes, investment and spending are being boosted by record high agricultural commodity export prices.

USD exporters:
“Playing the long game” with currency hedging has proven over the years to provide more certainty and financial benefits to local exporters in US dollars than the alternative of short-term instant gratification. Long-term, multiple year hedging of the NZD/USD exchange rate risk may seem on the surface to be a risky strategy or policy in a prolonged depreciating NZ dollar market environment for USD exporters, however there are two good reasons why local exporting companies operate such hedging programmes:-
- The “opportunity cost” of being hedged (fixed) at NZD/USD exchange rates above the current market spot rate is generally a lot less than the “real cost” of the NZD appreciating 10 cents in a short period and the exporting company being unhedged (i.e. profits unexpectedly lower).
- Exporting company shareholders do not tolerate wild volatility in profits and dividends, therefore they prefer playing the long game with multiple-year hedging than being exposed to the vagaries of the spot market.
Similar to mortgage borrowers, the exporting companies like the certainty of low volatility and trust that the hedging (fixing) benefits will outweigh any “regret factor” in the medium to longer term.
Currently, most local USD exporters are hedged to maximum policy limits at weighted-average NZD/USD exchange rates at or just below 0.6000. There has been a relatively large opportunity cost over recent years for the hedgers as the stronger US dollar on the world stage kept the NZD/USD rate on a downwards trend. The tide is now turning against the US dollar and the advantages of being highly hedged is likely to materially benefit the exporters and the wider economy over the next two years.
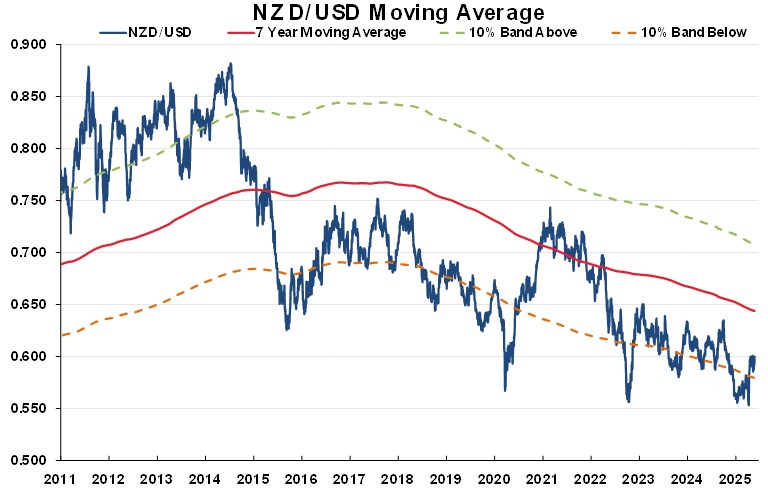
The three NZ dollar plunges below 0.6000 to 0.5500 in 2020, 2022 and late 2024 (refer to the chart below) have provided the opportunity for USD exporters to lock into attractively low NZD/USD exchange rates that provide certainty to cashflows, profits and future investment. Many exporters use a filter test of the rate being 10% below the seven-year average to extend hedging beyond the typical two-year time horizon. Such longer-term hedging certainly paid off in 2020 when the Kiwi dollar subsequently spiralled to above 0.7000. The long-dated hedging has been less value-accretive in recent years; however, the companies who have stuck with the hedging programmes are currently in a stable and predictable position against the paradigm shift in the US dollar’s value we are now witnessing.
Finally, the exporter’s patience is about to be rewarded.

Paradigm shift in the US dollar value only just starting
Foreign investors have invested US$26 trillion in US equities and bonds (increased from US$7 trillion in 2010. The funds attracted into the US by their superior economic and investment market performance. The current Trump regime has now totally upended the previous confidence and certainty that the US would outperform all other markets.
The foreign investors are now pulling their money out and/or downsizing their US risk for many reasons, however two economic policy changes by Trump are adding to the reasons to exit: -
- Trump is forcing large investment fund managers in the US (such as BlackRock) to change their environmental ESG policies and filters to allow more investment into mining and energy. European pension money invested in such funds is being withdrawn as their own ESG policies do not allow them to stay.
- Trump’s “One Big Beautiful Bill Act” includes sweeping changes to the tax treatment for foreign investors into the US. Section 899 will hit investors from “discriminatory foreign countries” that impose levies that disproportionately affect US companies. The net result is that investors from many countries will be paying higher US tax rates. In other words, Trump is using this tax change to start a capital war as well as a trade war.
Sovereign wealth funds and large investment funds around the world are correct to conclude that the US does not want their money. The irony and tragedy in this saga is that the US Government depends on foreign investors to fund their debt and deficits as the US does not have sufficient domestic savings to fund their own debt. The US relies on foreign investors, but Trump, leading a large debtor nation, has no comprehension of this fact.
He is scaring his own lenders away, which never ends well for any borrower!
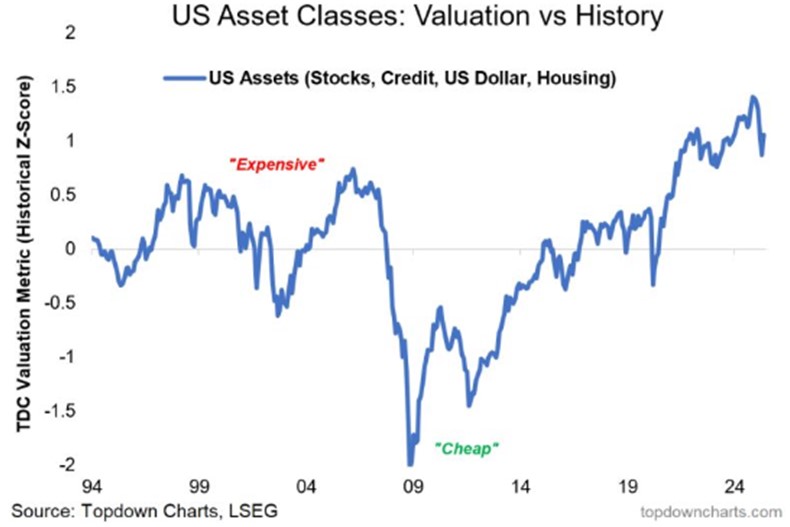
The chart below provides an informative picture of where US investment asset classes have reached in the valuation stakes after 15 years of US exceptionalism. It is easy to conclude that the paradigm shift downwards in the US dollar’s value has only just started as foreign investors continue to exit their funds over coming months/years.

Going back to the US$26 trillion foreign investors hold in US equities and bonds mentioned above, a tiny 1.00% downward adjustment in their investment weighting or a 1.00% increase in their FX hedging against a depreciating USD value, is equivalent to selling US$260 billion across the FX markets. The numbers are gigantic, and whilst the global currency markets have the daily liquidity to cater for such large-scale USD selling, the transactions are all one-way. The foreign disinvestment to date is why the US dollar has depreciated 10% since January 2025. There is much more to come as European and Asian investors take several months to obtain the necessary approvals from their Investment Committees and Boards to execute the trades.
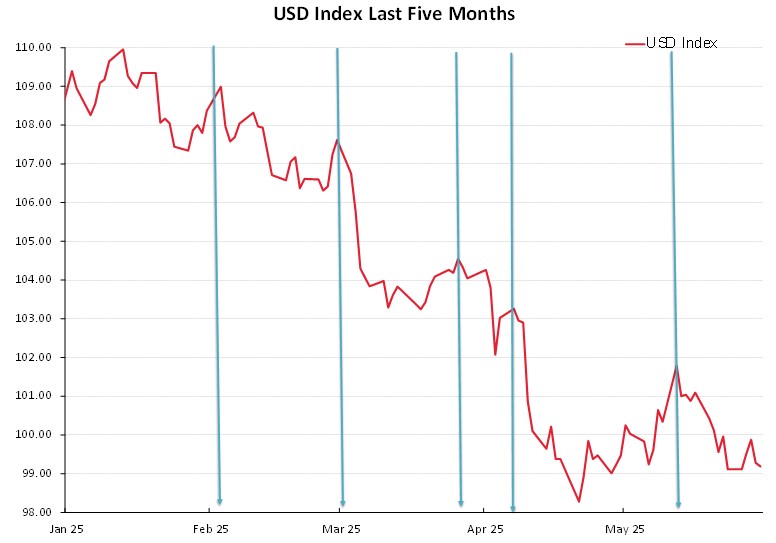
The constant USD selling by foreign investors exiting the US markets explains why every small recovery upwards in the USD Index over recent months is hit with a subsequent barrage of USD selling. Each USD recovery upwards is peaking at a lower point than the previous one (as the chart below confirms). The small USD recovery up to 100.00 on the USD Index last week appears to have met the same fate as all the previous recoveries.
The preferred Federal Reserve measure of annual headline inflation, the PCE index, has decreased to its lowest level in four years at 2.10%. Outside of what import tariffs may do to the US inflation rate later in the year, the Fed would today be aggressively cutting their interest rates from above the restrictive 4.00% level to nearer their “neutral rate” around 3.00%. Their 2.00% annual inflation target has been achieved. The reason they are not cutting today is that they are very uncertain as to the impact of tariffs on future inflation and they are not convinced that the labour market is softening.
It will take at least two months of weak Non-Farm Payrolls jobs numbers to convince the Fed to shift away from their current “wait and see” stance. The May jobs numbers this Friday night 6th June well below +150,000 should be the first piece of evidence to sway the Fed to recommence their monetary easing cycle. Just another reason why the US dollar Index is headed towards 95.00.

Daily exchange rates
Select chart tabs
*Roger J Kerr is Executive Chairman of Barrington Treasury Services NZ Limited. He has written commentaries on the NZ dollar since 1981.

We welcome your comments below. If you are not already registered, please register to comment
Remember we welcome robust, respectful and insightful debate. We don't welcome abusive or defamatory comments and will de-register those repeatedly making such comments. Our current comment policy is here.