

Summary of key points: -
- A mixed bag of US economic data bounces the US Dollar around
- Why Japanese Yen movements are important for NZ dollar direction
- The bread and butter of New Zealand’s freight costs
A mixed bag of US economic data bounces the US Dollar around
The global financial and investment markets are now seeking corroborating soft US economic data to go along with the plunge in new jobs, to firm up the view that US interest rates and the US dollar move significantly lower from here. The wave of economic data over this last week would not have helped to provide that assurance, as it was a real mixed bag of good and not so good.
The following economic data releases have arguably introduced more uncertainty into the view as to how much the Federal Reserve will cut their official interest rates over the balance of 2025: -
- CPI Inflation numbers for July earlier in the week were bang on prior forecasts at a +0.20% result. The USD weakened on that news as there was clearly relief that tariffs had not shunted the inflation rate higher than anticipated.
- Wholesale prices (PPI) for July released on Thursday 14th August came in at a much higher +0.90%, well above prior consensus forecasts. The USD appreciated following the receipt of that information as it pointed to tariff costs being passed through into wholesale prices, which eventually feeds through into retail prices.
- On Friday 15th August US Retail Sales for July printed at +0.50%, again bang on prior forecasts.
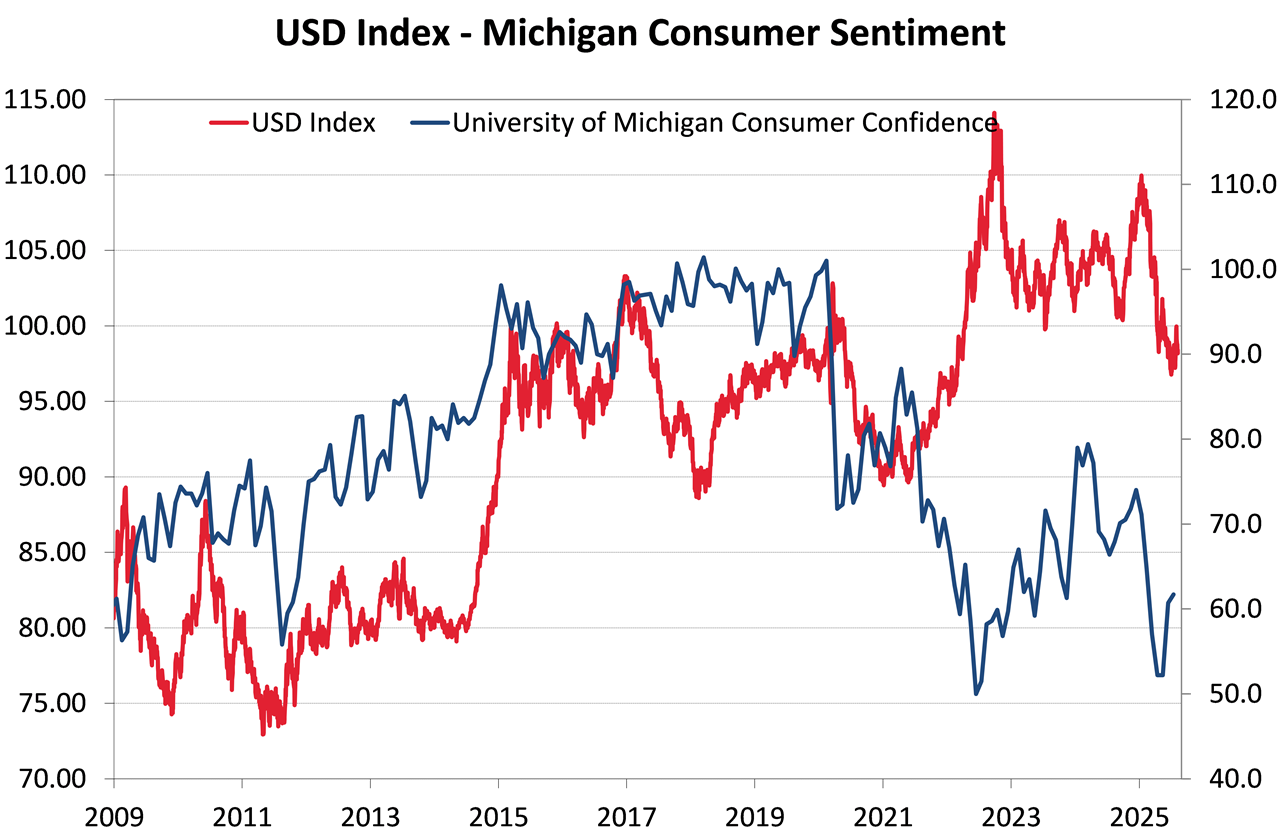
- The University of Michigan Consumer Sentiment survey turned down again in August, dropping from 61.7 in July to 58.6 (weaker than forecast). Because of that softer piece of data, the USD Dixy Index depreciated from 98.15 to 97.70.
Fed members voting on future interest rate cuts would have been hoping for more conclusive evidence of the economy slowing up in line with the rapid fall off in the labour market.
Looking forward to the economic lead indicators coming up over coming weeks, the key releases to watch out for include: -
- PCE Price Index for July on Friday 29th August – a 0.20% increase is forecast.
- August ISM Manufacturing PMI on Tuesday 2nd September – a stable 48.00 result is forecast; the USD will depreciate further if it is well below forecast.
- August Non-Farm Payrolls jobs figures on Friday 5th September are forecast to be a weak 50,000 increase in jobs. Such an outcome would confirm the rapid deterioration in employment and perhaps prompt the Fed to a jumbo 0.50% cut on 17th September.
The markets will also be focused on Fed Chair, Jerome Powell’s speech at the Jackson Hole Symposium for central bankers on Friday 22nd August. Hints to his responses in respect to recent employment and inflation trends will be closely monitored.
Our view remains unchanged; the Fed need to shift promptly from the current “moderately restrictive” monetary policy (4.35% Fed Funds interest rate) to somewhere nearer a “neutral” setting of a 3.00% Fed Funds interest rate.
Forward looking economic indicators such as the Michigan Consumer Sentiment Index suggests that US households will be very cautious over coming months with escalating job insecurity and worries about price increases. The debate rages on as to where the bulk of the tariff costs will fall. Recent Goldman Sachs economic analysis concluded that to date end-consumers have only paid 14% of the tariff costs with business firms along the supply chain absorbing the rest. The 14% burden on consumers is expected to increase over coming months, however maybe not as much as many think as weak consumer demand means lower pricing power for retailers.
The chart below plots the relationship between household/consumer sentiment in the US (blue line – right hand axis) against the US Dollar Dixy Index (red line – left hand axis). History tells us that the USD currently has much further to depreciate.
Why Japanese Yen movements are important for NZ dollar direction
Now that it is confirmed that US tariffs on Japanese exports are 15% and not the earlier feared 25%, the Bank of Japan are back debating the speed and extent of their future interest rate hikes. They had been holding off from further increases over recent months as they feared 25% tariffs would damage the Japanese economy. That is no longer the case. “The balance within the Bank of Japan Board seems to be tilting more hawkish, which reinforces the chance of another rate hike this year” Daiwa Securities analysts wrote in a research note. The current Japanese annual rate of inflation is 3.30% with the next update for the month of July on 22nd August. The Bank of Japan next meet on Friday 19th September and it must be on the cards that they will be lifting their interest rate higher from the current 0.50% setting.
With Japan increasing their short-term interest rates over coming months and the US Federal Reserve doing the exact opposite with cutting interest rates, the USD/JPY exchange rate must be under pressure to move down (Yen strengthening) from its current 147.20 level.
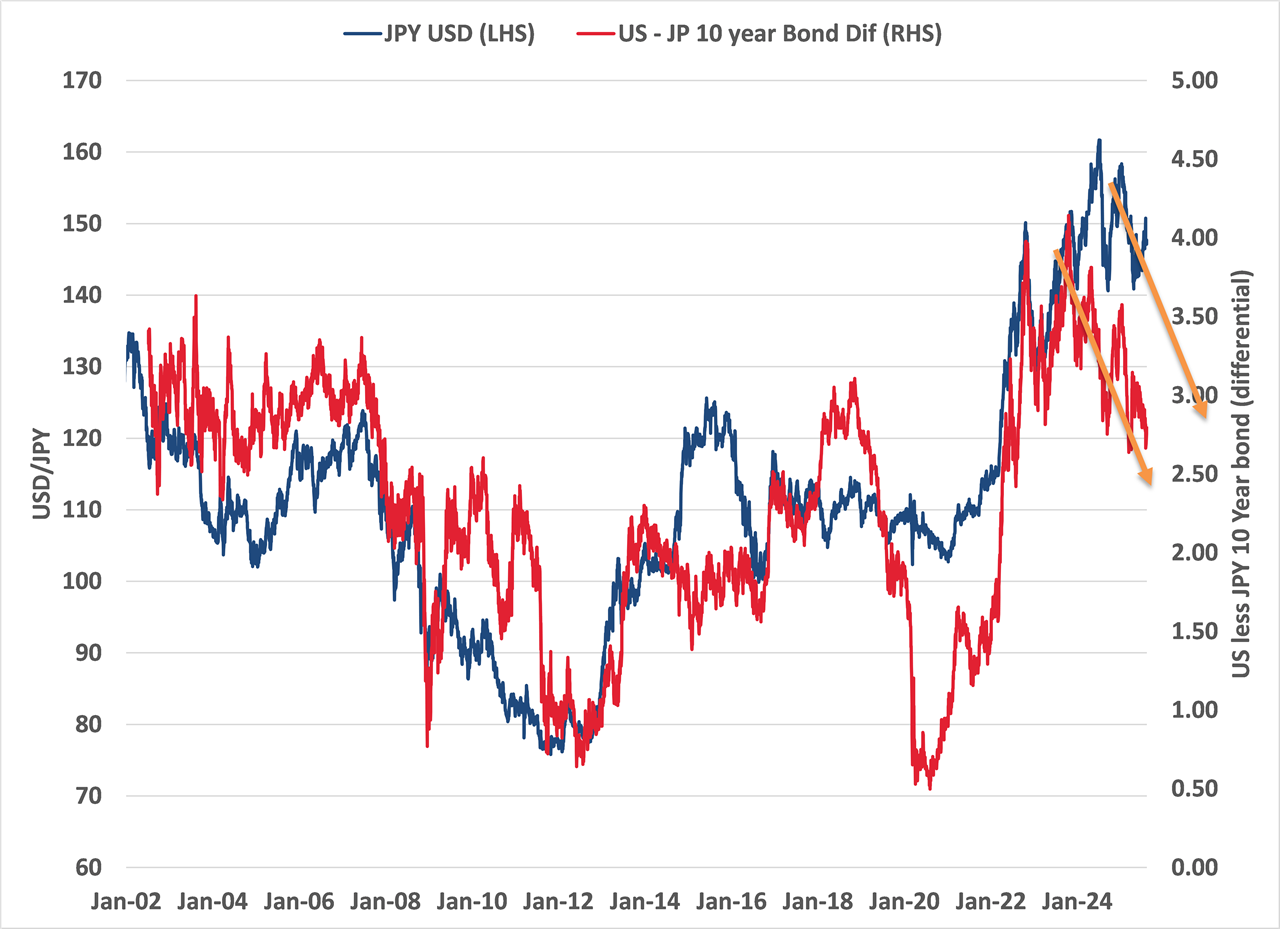
Long-term interest rate differentials between Japan and the US also play a major role in determining the direction of the USD/JPY exchange rate. Two years ago, the gap between Japanese and US 10-year Government bond yields was 4.00% (US = 4.60%: Japan = 0.60%). Today, that gap has closed to 2.70% (US = 4.20%: Japan = 1.50%). Changes to both countries short-term interest rates over coming months points to the bond yield gap closing further to 2.00% (US =4.00%: Japan = 2.00%).
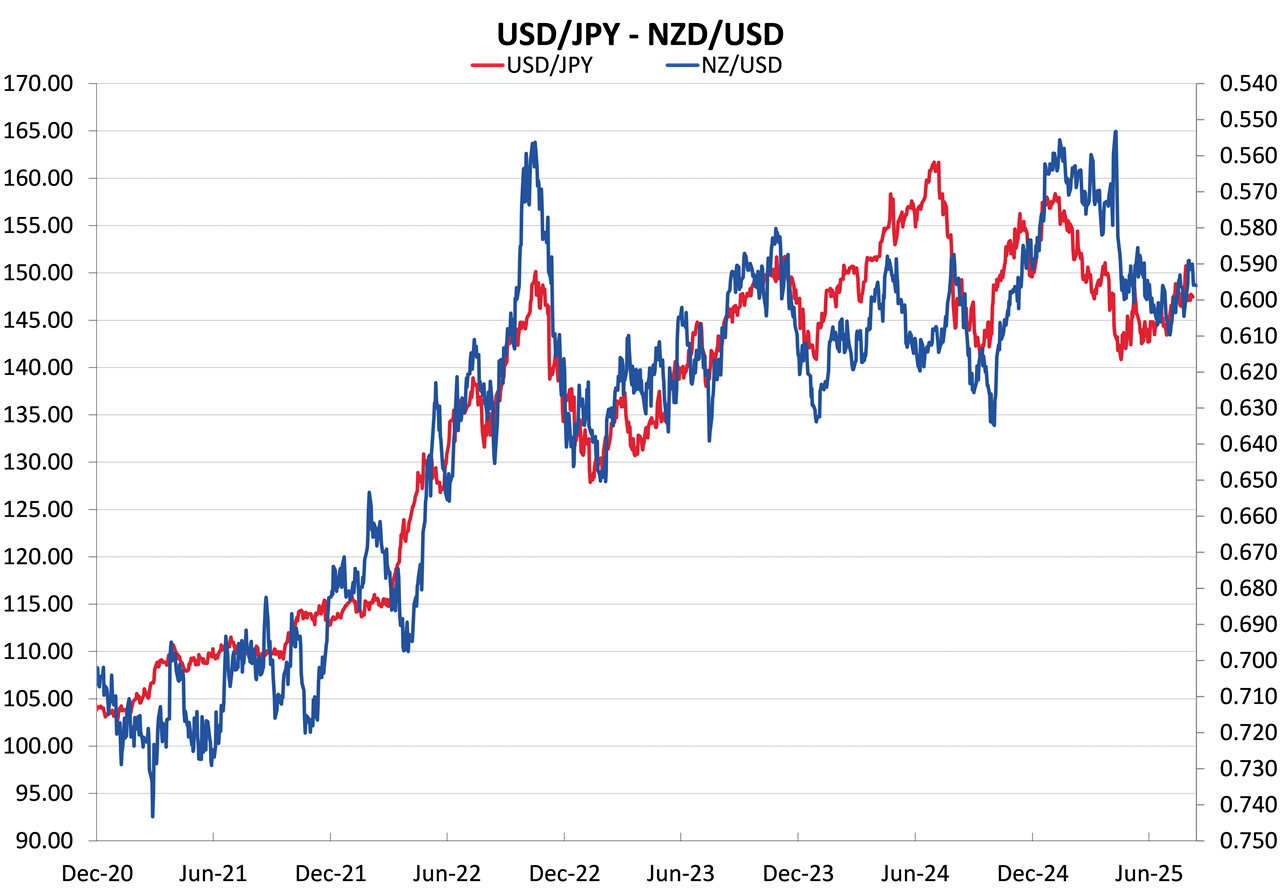
The chart below shows the close correlation between the bond yield gap (red line – right hand axis) and the USD/JPY exchange rate (blue line – left hand axis). The decrease in the bond yield differential to 2.70% suggest that the Yen should be on track to strengthen to the 130 to 120 region against the USD. A 130 USD/JPY rate equates to an NZD/USD exchange rate nearer to 0.6450 (second chart).
The bread and butter of New Zealand’s freight costs
The RBNZ will be cutting their OCR interest rate by 0.25% to 3.00% this Wednesday, however, do not expect clear-cut forward guidance from them that they will be looking at further cuts below that level. Food inflation is rising, and inflation expectations are also on the rise. Our view is that the RBNZ will state that a pre-condition for further interest rate decreases below 3.00% will be economic growth over the second half of 2025 being below their current GDP growth forecasts. We expect GDP growth over the September and December quarters to be reasonably robust with strong export sector activity levels combining with a pickup in domestic housing and retail activity as lower mortgage interest rates finally kick-in. Do not expect any great reaction by the FX markets in pricing the NZD/USD exchange rate lower following the 0.25% cut, as it is already fully priced-in in advance. If the RBNZ tone is less dovish than what must bank economist pundits expect, the Kiwi dollar could well receive a little boost from the RBNZ statement.
The RBNZ like to cite recently released “high frequency” short-term economic data is signalling a change in the economy. Unfortunately, recent stronger high frequency data in the form of the ANZ truckometer and electronic retail card spending for July has not fitted the narrative of many local economists who are calling for OCR rate cuts to 2.50% because the economy is falling into another recessionary hole.
One perplexing aspect of the New Zealand economy currently is the politicians and the mainstream media attempting to find someone to blame for the increase in the price of butter. Everyone should understand that the overseas export price for dairy products sets the domestic price. However, if that is the case, why is a kg of New Zealand butter cheaper in supermarkets in Australia than the price in supermarkets in New Zealand? The politicians, the media and the Commerce Commission are all likely barking up the wrong tree in accusing the butter manufacturers and retailers taking larger profit margins in New Zealand. The cause of the price difference between Australia and New Zealand is mostly due to the local transport freight costs per/kg being more than the per/kg container sea freight costs to Australia. International container sea freight has excellent “economies of scale”, whereas our domestic transport/freight networks sadly do not.
A further example of the freight cost problem in New Zealand is seen with the importing of grain to make bread in the North Island. We grow most of our grain in the South Island, however the freight cost to transport that grain to the North Island is greater than the freight cost to import grain for the North Island millers and bread bakers. Again, a volume question and economies of scale.
Perhaps the Commerce Commission should be examining internal freight economics, efficiency, market dominance and price setting behaviour?
Daily exchange rates
Select chart tabs
*Roger J Kerr is Executive Chairman of Barrington Treasury Services NZ Limited. He has written commentaries on the NZ dollar since 1981.
We welcome your comments below. If you are not already registered, please register to comment
Remember we welcome robust, respectful and insightful debate. We don't welcome abusive or defamatory comments and will de-register those repeatedly making such comments. Our current comment policy is here.