

Welcome to New Zealand Dr Breman, it will be good for us to have an external, impartial and fresh set of eyes heading up our central bank. The bank’s performance track record has been somewhat patchy in recent years, and everyone is looking forward to renewed clarity and certainty.
The New Zealand economy is completely different to the economies in Europe; therefore, we thought we would outline some of its unique characteristics and attributes you will need to understand to make monetary policy decisions: -
Changes to monetary policy settings (raising and lowering interest rates) operates with a well-defined time lag in New Zealand. From the time the RBNZ signals that interest rates are going down, it typically takes 12 months for the transmission mechanisms to work through the economy and deliver the desired responses in terms of higher spending and investment. The lag is caused by the banks competing for new and repeat business in the one and two year fixed-rate interest rate space of the mortgage lending market. These are always the lowest interest rates on offer, therefore 80% of home mortgage borrowers fix their rates for one and two years. The lag in the current monetary easing cycle is proving to be longer than normal. That is due to too many mortgage borrowers taking on too much debt in the housing boom in 2021 and 2022 when Kiwis went crazy on sub-3.00% mortgage interest rates. That boom was largely caused by the RBNZ printing too much money and the provision of cheap loans to the banks for too long in the Covid crisis. Understanding the causes of the current predicament of the domestic economy centres back on past RBNZ decisions.
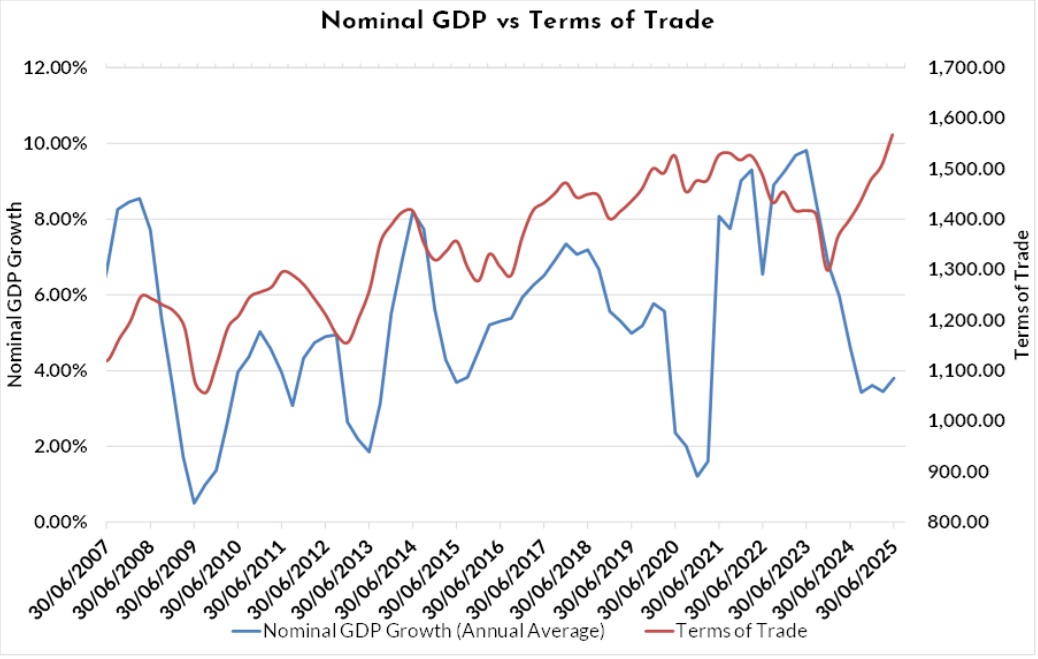
Economic growth and wealth is driven by the export sector. Some bank economists will try to influence you that inflation and economic performance is all about the residential real estate market that they lend to. The performance of the export sector determines incomes and economic growth in New Zealand. Buying and selling fixed assets, such as houses, between ourselves adds nothing to economic growth and our standard of living. Right now, high export commodity prices and a Kiwi dollar at a cyclical low is delivering a strong export performance. Most local economic commentators are just too impatient to see this transfer through into increased investment and spending in the cities. It is inevitable that the export growth will feed into the wider economy over the next 12 months. The chart below is a salient reminder that GDP growth follows export prices in New Zealand.
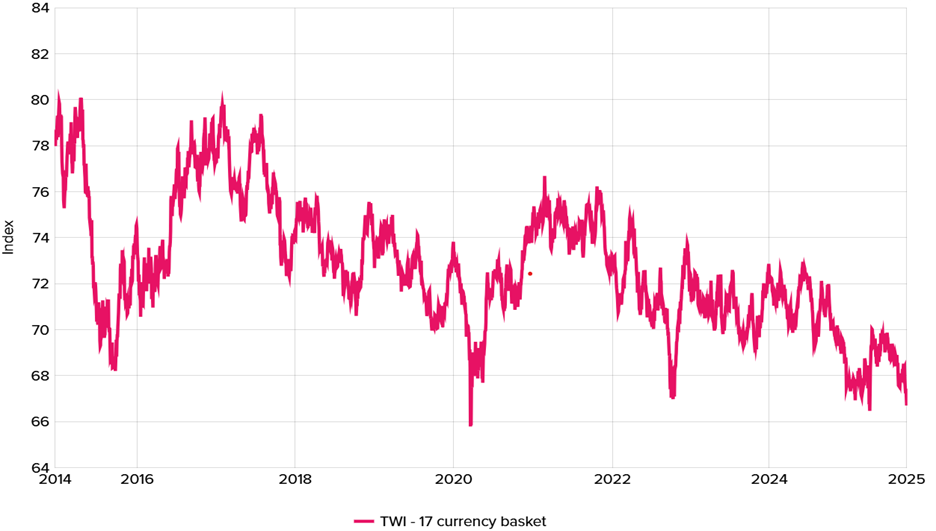
The NZD exchange rate plays a pivotal role in the economy. Unlike the larger industrialised and service-centred economies in the world, our exchange rate has a direct and significant impact on both the income and cost side of the economy. We have very high import penetration compared to others; therefore, a prolonged NZ dollar depreciation pushes up tradable inflation and improves export incomes (and vice versa). The NZD/USD exchange rate is largely driven by the interest rate differential to US interest rates. Over recent times, our interest rates have been below those of the US, therefore that is why the Kiwi dollar is bouncing along the bottom of its cyclical ranges. The sharp drop in the NZD against the AUD (from 0.9300 to 0.8800) over recent weeks will be adding to inflation through higher costs on goods imported from Australia. The current NZ Trade Weighted Index (‘TWI”) at 67.36 is at a low point of the last five years and is below the RBNZ assumption of 68.0 for their inflation forecasts over the next 12 months (refer chart below)
Sticky high domestic inflation is an ongoing/challenging issue. Tradable inflation goes up and down with the currency value, commodity prices and oil prices. Non-tradable inflation (prices set in the domestic economy) has been at elevated levels near to 3.00% pa for many years. There are multiple reasons for the stubbornly higher domestic inflation: -
- Poor economies of scale in New Zealand, reducing competition.
- Monopolies, duopolies and oligopolies operating “cost plus” business models.
- Duplication and bloated bureaucracy in central and local government.
- Regulatory overload adding unnecessary costs that are passed through to the consumer.
Low quality/standards of economic data. The official measure of economic activity, GDP, from Statistics NZ is released more than two months after the end of each quarter. Over recent years the regular historical revisions have caused headaches for the RBNZ. Two thirds of the 0.90% GDP contraction in the June quarter was “balancing items on seasonal adjustments”, unrelated to any industry sector. Dr Breman, please treat the GDP data with a good dose of scepticism, it is unreliable. We are finally moving to monthly CPI inflation measures, which will be an improvement.
Reports are that Dr Breman was a keen advocate for greater transparency around central bank decision making when she was a Deputy Governor of Sweden’s Riksbank. Hopefully, the financial markets here can look forward to the publishing of the full Monetary Policy Committee meeting minutes and the disclosure of how individual members of the committee vote on interest rate setting decisions. On the topic of transparency and sunlight being the best disinfectant, the new Governor should also be insisting on full disclosure of interests (to declare conflicts of interest) when bank economists bay for repeated interest rate cuts by the RBNZ. The banks are “talking their own book” when they do this, as lower mortgage interest rates induces rising house prices, which in turn delivers increased lending by the banks and therefore enhancing their profitability. It is remarkable that this massive conflict is rarely called out in New Zealand.
It has also been reported that Dr Breman has a clear understanding that the RBNZ’s sole remit is to keep inflation between 1.00% and 3.00%. The RBNZ’s mandate does not extend to saving jobs, the housing market or economic growth, as many economic commentators currently seem to think it should be!
Australian inflation not decreasing as most expected
The sharply lower NZD/AUD cross-rate to 0.8825 has been largely attributable to the Aussie dollar proving to be much more resilient than the Kiwi dollar against another bout of short-term US dollar strength. The NZD/USD rate is back 2½ cents from 0.6000 to 0.5750 over the last 10 days (the GDP shock adding to the underperformance), whereas the AUD/USD rate currently at 0.6530, has only retreated 1½ cents from 0.6680.
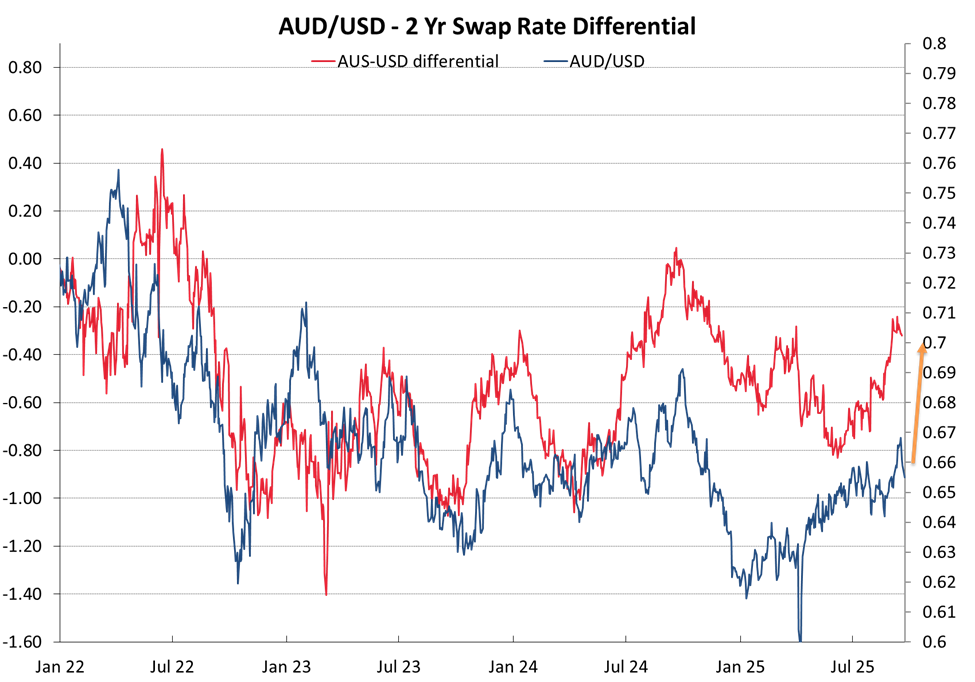
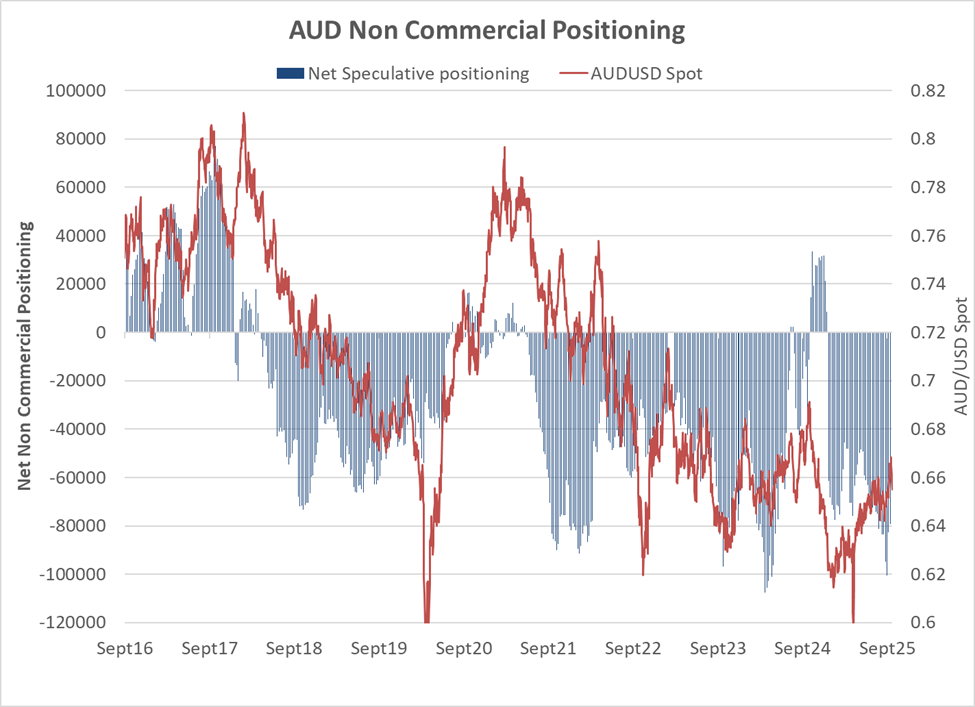
One reason why the FX markets have a little less reluctant to sell the Aussie dollar at this time is that the speculative market is already heavily “short-sold” the AUD (refer to the second chart below). The large AUD short-sold speculative positioning has been in place for some time and was originally put on when Australian interest rates were 1.00% below US interest rates in early 2024 i.e the punters were paid the forward points to short-sell the AUD, so-called easy money. Today, the interest rate gap has closed right up to 0.30% (first chart below). The short-sold AUD trade has to be regarded as crowded, mature and over-extended (i.e. ripe for reversal) with little potential for the AUD to depreciate any further with the rapid closing of the interest rate gap.
Another good reason why the Aussie dollar is holding its own, is the fact rising inflation in Australia has effectively postponed any further interest rate cuts by the Reserve Bank of Australia (“RBA”). The annual rate of inflation jumped up to 3.00% in August from 2.80% in July. Market interest rates have reversed out the previous forward pricing of further RBA cuts before Christmas. Two weeks ago, the markets were pricing a 100% probability of a 0.25% cut in November, today that has reduced to only a 37% chance. Some economists in Australia downplay the monthly inflation data, citing the fact that the RBA themselves prefer quarterly numbers. The September quarter’s inflation data is due for release on 29th October.
Australian housing inflation in August rose to 4.50% from 3.60% in July, marking a 14-month high. The inflation increase was largely attributed to a 24.60% surge in electricity prices, as State Government rebates were gradually exhausted by households.
The AUD is once again poised for a major push higher as the market positioning and economic forces provide the ripe pre-conditions. All it needs is for the US dollar to reverse out of its minor period of strength. US economic data is continuing to be inconsistent and contradictory, leaving the Fed and market participants a bit perplexed as to the underlying strength of the economy. US GDP numbers for June quarter were revised higher (increased consumer spending) and retail sales figures have been better than expected of late. On the other hand, employment has tumbled, and consumer confidence continues to fall. There is no question that the lower socio-economic groups in American society have been hit the hardest with fewer jobs and some living costs higher from Trump’s tariffs, whereas the higher income earners have continued benefits from income tax cuts.
The USD Dixy Index looks to have completed another uptick to above 98.00. US PCE inflation data on Friday 26th September provided no surprises with the annual headline rate increasing a fraction from 2.60% to 2.70% (below the +2.80% forecast). The US data the markets will be centred on this week will be the JOLTS job vacancies, ISM manufacturing index and the Non-Farm Payrolls for September on Friday 3rd October. Consensus forecasts are for another soft monthly jobs increase of 40,000 to 50,000. The aforementioned economic releases are expected to be on the weaker side, so the greater probability is that the USD Index returns to 96.00 from its current 97.80 level. A return of the USD to its depreciating trend will allow the NZD/USD exchange rate to recover from 0.5750 to near 0.6000 in the short-term.
Daily exchange rates
Select chart tabs
*Roger J Kerr is Executive Chairman of Barrington Treasury Services NZ Limited. He has written commentaries on the NZ dollar since 1981.
We welcome your comments below. If you are not already registered, please register to comment
Remember we welcome robust, respectful and insightful debate. We don't welcome abusive or defamatory comments and will de-register those repeatedly making such comments. Our current comment policy is here.