
Summary of key points: -
- Lack of progress in the Iranian war boosts “risk-off” sentiment in FX markets
- US GDP growth revised lower, commensurate with the deterioration in employment
- NZ dollar plunge against the Aussie dollar – is it sustainable?
Lack of progress in the Iranian war boosts “risk-off” sentiment in FX markets
Geo-political “risk-off” sentiment in global financial/investment markers, currency markets in particular, hit hard with some increased vengeance this last week as the Iranian war moved through its second week without any discernible progress for the US/Israeli aggressors.
Everyone and his/her dog is attempting to work out what Trump’s exit strategy and “victory” looks like. As time goes on the much vaunted “regime change” from the people within Iran looks increasingly unlikely. Trump has stated that the Stari of Hormuz will re-open with US military escorts, however, there seems to be no plan or assets in place to make that happen. He is now calling for other nations to provide warships to protect shipping through the Strait. No-one really knows what true state of the Iranian military or Government is, to gauge how long it may take for them to capitulate, so Trump can claim his “win”. Trump is coming under increasing political pressure back at home as the US economy stalls and Trump’s own peculiar measures of economic performance, higher stock market and lower oil prices, are both heading in the wrong way for him.
The probability weightings on the three outcome scenarios we covered in last week’s report have shifted to a lower 25% probability for the “quick surrender” scenario 1, and a higher 65% probability for the second scenario of slower progress to ending the missile strikes on Iran. However, the next week of action may change those weightings again.
There was initially a muted response by the FX markets to the start of the Iranian war two weeks ago, however over recent days as the markets realise that Trump is already running out of options for a “quick win”, the intensity of the US dollar buying has lifted. The USD Dixy Index appreciated from the 98.70 area two days ago to the current 100.36 level. All the major currencies have weakened against the USD on the USD safe-haven buying, sending the NZD/USD exchange back to the previous lower trading range at 0.5775. It will require a confirmation that the Iranian military and Government are on the brink of surrendering, to turn the markets around. When that happens, as it seems it inevitably will, oil prices will plummet to back below US$70.00/barrel and the USD Index will recoil to the 97.00 level prevailing before the war started. The buying of the US dollar over recent days appears short-term speculative/trading position-taking in nature and will rapidly unwind when the narrative on the war turns the other way. The probability of a protracted quagmire of a war still seems low, as Trump is running out of runway ahead of the mid-term elections only eight months away in November.
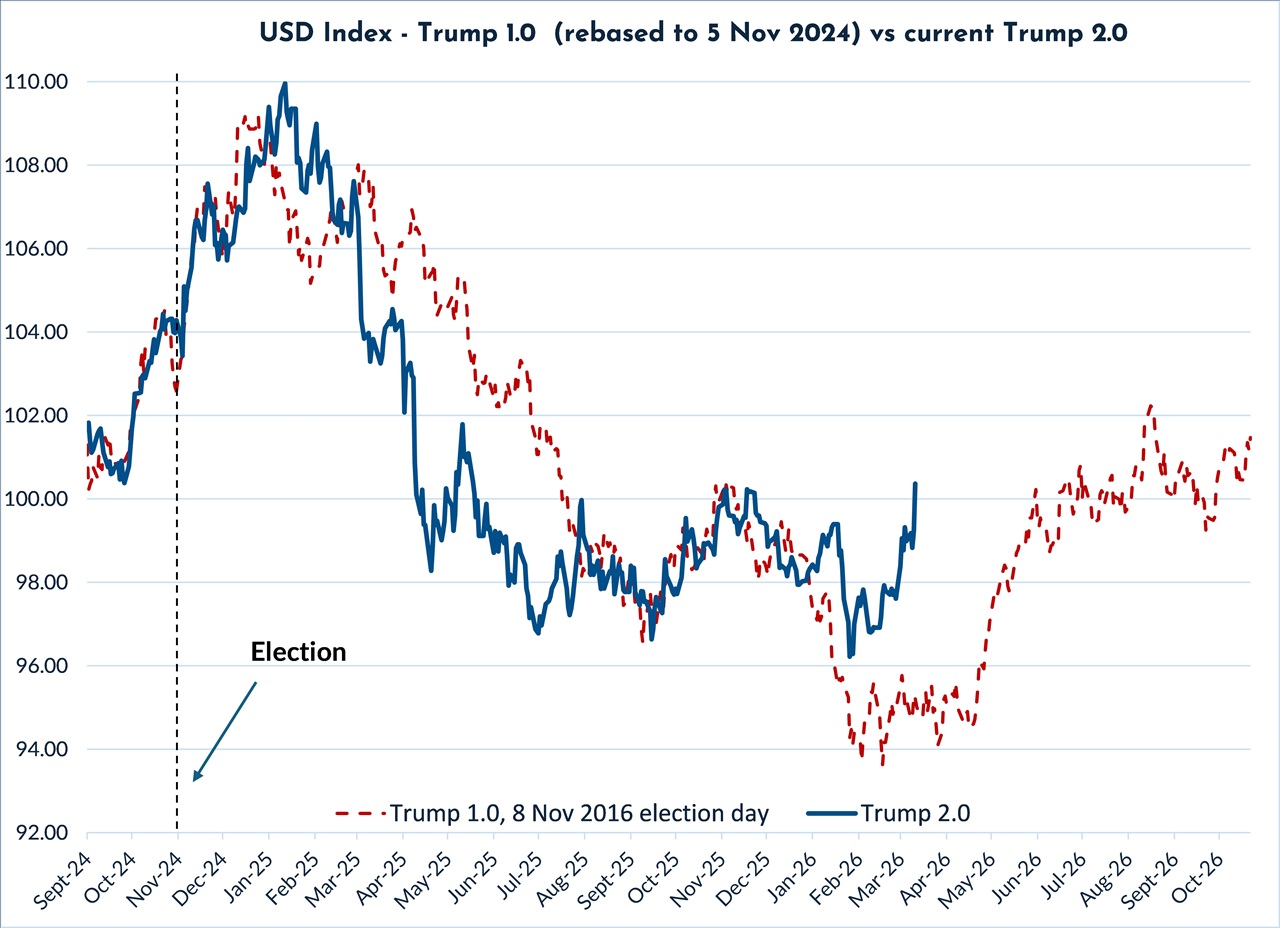
Our reliable performance track-record of the USD following what happened eight years ago in Trump’s first term is under serious pressure as the USD spikes higher to 100.36, instead of falling further on lower US interest rates in 2026. The interest rate markets are now pricing in zero cuts to the Fed Funds interest rate this year with the two-year Treasury Bond yield lifting to an eight-month high of 3.73%. Expect this yield to reverse dramatically to 3.50% and below on an end to the war.
The war has disrupted the previously reliable playbook for USD direction and trading strategies, refer to the chart below.
US GDP growth revised lower, commensurate with the deterioration in employment
Two data releases last Friday confirmed the weaker economic trajectory over recent months; however, the information had no impact on interest rates or currencies as the Iranian war dominates the landscape: -
- The GDP growth number for the December 2025 quarter, previously released at a 1.40% annual growth rate, was revised lower to just 0.70%. The downward revisions were in exports, consumer spending, government spending and investment.
- The University of Michigan Consumer Sentiment Index fell to 55.5 in March from 56.6 in February. Expectations around future inflation reduced.
Higher gasoline prices from higher oil prices will push up US headline inflation in the short-term, however the higher gas prices act as a tax to hurt discretionary spending and therefore eases inflationary pressures in other areas in the medium term. The Federal Reserve meets this week. They will not be changing interest rates and will need to be very circumspect on inflation, the labour market and the economy as a prolonged war leads to the worst-case scenario of stagflation (no growth with increasing inflation). The Fed will initially “look through” higher inflation from the higher oil prices. They will only adjust monetary policy if the higher oil prices lead to second-round impacts of other goods and services price increases. We are not at that point yet.
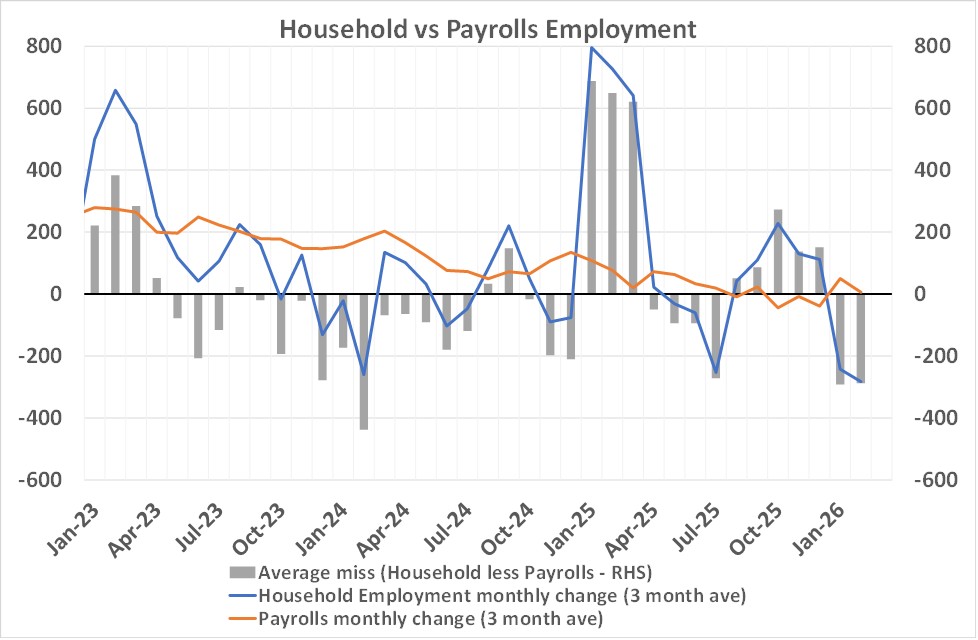
It pays to look beyond the headlines when analysing the trends of US employment. Volatile monthly Non-Farm Payrolls job increases and decreases can cloud the overall picture. The official unemployment rate in the US comes from a second survey of households, separate from the Non-Farm Payrolls data which is a survey of business firms.
The orange line in the chart below plots the three-month average of Non-Farm Payroll results against the three-month average of employment change from the household survey (blue line). The downwards trajectory of Non-Farm Payrolls is very clear. The household survey of employment has fallen away again in recent months. The grey bars show the difference between the two employment surveys. When the more volatile household employment survey is much weaker than the Non-Farm Payrolls numbers (grey bars negative), the Non-Farm Payrolls numbers are subsequently weaker over following months. In 2024, the negative grey bars lead to the decreasing three-month average for Non-Farm Payroll jobs results. We can expect close to zero or negative monthly Non-Farm Payroll results over coming months. The Fed will be well aware of these trends, however some of the Fed FOMC members may be on another planet as their speeches still talk about a “robust” labour market.
Ahead of the Fed this Thursday morning, industrial and manufacturing production data for February should further confirm the slowdown in the US economy, giving the Fed much to think about over and above the war. If the war was not happening at this time, the Fed would be under a lot of pressure to cut interest rates on the employment side of their dual mandate, as the labour market deteriorates.
NZ dollar plunge against the Aussie dollar – is it sustainable?
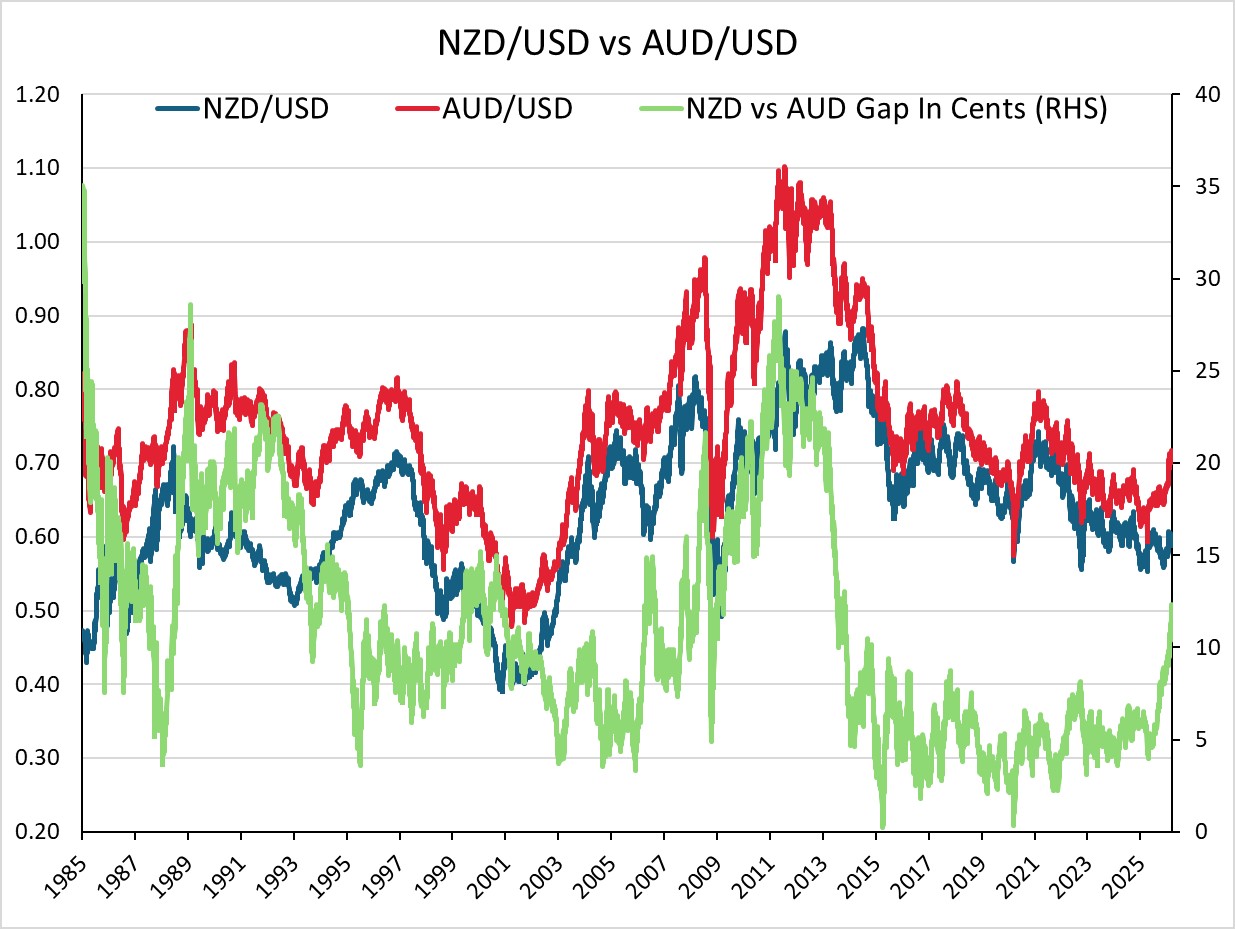
The NZD/USD cross rate plummeted to new 11-year lows below 0.8300 this week as the Australian dollar continues to outperform the Kiwi dollar against the USD. The gap between the NZD/USD and AUD/USD exchange rates is now 11 cents (0.5780 versus 0.6980), the highest it has been since 2015 (refer to the chart below). Over the last 10 years the gap between the two rates (green line on the chart) has averaged five to six cents, reflecting New Zealand’s improving economic performance relative to Australia’s. That improvement and stability in the NZD/AUD cross-rate relationship have now been shattered by the two diametrically opposed paths the RBNZ and RBA are now on. The RBA has pivoted from cutting interest rates to hiking interest rates as they realise they do not have inflation under control within their target band. The RBNZ have not yet recognised that they might have a problem with inflation being stubbornly and sticky high, well above their target of 2.00%. The sharply lower NZD/AUD cross-rate is the result of this timing gap between the RBA acting to tighten monetary policy and the RBNZ not being at that point yet.
The RBA meet this Tuesday afternoon and are widely expected to increase their OCR from 3.85% to 4.10% (70% priced). A speech last week from their Deputy Governor, Andrew Hauser confirmed that they should not be waiting to adjust interest rates higher. The Iranian war complicates the RBA decision, and it would not be a great surprise to the writer if they held off from another rate hike at this time, due to the global uncertainty. It would, however, be a major surprise to the financial markets if the RBA did not hike and the Aussie dollar would depreciate on its own as a consequence.
Looking ahead, one could paint a picture for the second half of 2026 of the RBA having finished their interest rate increases at 4.10% or 4.35% over coming months, whereas the RBNZ will be commencing a succession of interest rate increases to above 3.00% from August or September. The current OCR interest rate gap is 1.60% (potentially increased to 1.85% on Tuesday). However, by the end of the year that gap could be reduced to 1.10%. Foreign exchange markets always look forward, therefore at some point, the NZD/AUD cross-rate will reverse out of its spiral downwards and start to move upwards again as the Kiwi dollar responds more positively to its interest rate increases, whereas the AUD will not be in that situation.
Prior to 2015, it was not unusual for the AUD/USD exchange rate to have periods of being 10, 20 and 30 cents above the NZD/USD exchange rate. Mining commodity booms being the major reasons for the AUD outperformance. However, that is not the situation currently as New Zealand enjoys an export commodity price boom and Australian mining/resources prices are stable. The current 11 cent gaps in the exchange rates is not a fundament shift in economic fortunes, merely a timing difference in recognising persistent inflation by the two central banks.
Given the analysis above, the NZD/AUD exchange rate may have dropped as far as it is going go. A closing of the current 11 cent gap to eight cents would see the NZD/AUD cross-rate return to 0.8900. Exporters selling in AUD’s would be advised to be hedging two and three years forward and should be prepared to “pay away” the forward points that are added on, to secure hedged exchange rates around 0.8500 and 0.8600.
Daily exchange rates
Select chart tabs
*Roger J Kerr is Executive Chairman of Barrington Treasury Services NZ Limited. He has written commentaries on the NZ dollar since 1981.
We welcome your comments below. If you are not already registered, please register to comment
Remember we welcome robust, respectful and insightful debate. We don't welcome abusive or defamatory comments and will de-register those repeatedly making such comments. Our current comment policy is here.