

Summary of key points: -
- Will Trump’s latest war timeline be any more accurate than his previous attempts?
- Are the latest US jobs numbers as untrustworthy as the previous data?
- Are the Japanese preparing for Yen currency intervention again?
- Why has the Chinese Yuan defied the odds against the stronger USD?
Will Trump’s latest war timeline be any more accurate than his previous attempts?
A re-escalation in the Iranian war has been the result from US President Donald Trumps’ address to the nation last week. There were expectations in the financial markets and the oil market, in the lead up to the speech, that his words would signal a de-escalation in the conflict and progress towards a diplomatic resolution with the Iranian leadership. Unfortunately, he delivered the opposite.
Trump is proving to be as impossible to read as ever! Creating chaos, unpredictability and inconsistency continue to be his hallmarks as a political leader. The problem for Trump now is that previously his rhetoric had the power to move market pricing, that power is being diminished as more and more market participants just do not trust or believe what he says is anywhere near the truth. The ever-changeable ultimatums (remember the 10 days to 6th April?) are no longer washing with the markets. There appears to be little confidence that his latest timing of completing the job in “two weeks, maybe three” will be any closer to reality than the previous four ultimatums he has delivered and then quickly forgotten about as the reality of the war is not exactly going his way. It also appears that the “talks” between the Americans and Iranians, via Pakistan as an intermediary, are nothing more than the US messaging a list of demands and the Iranians messaging back a rejection and a list of their own demands.
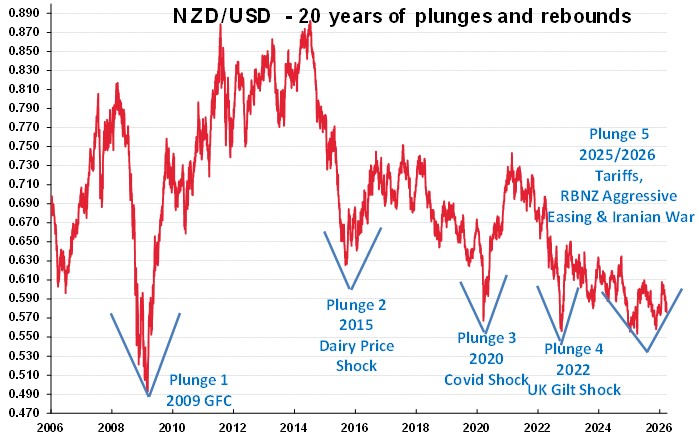
The world is left none the wiser as to whether the US is any nearer to achieving its objectives in attacking Iran, or not. It would also be good to know what those original objectives were as well! The disappointment following the speech sent oil prices back up to fresh highs and the US dollar appreciating in value to 100.00 on the Dixy Index. The stronger US dollar has pushed the NZD/USD exchange rate below its previous support level of 0.5700. Over recent years, the pushes below 0.5700 towards 0.5500 in the Kiwi dollar have all tended to be short-lived in nature for whatever reason. The latest bout of NZ dollar depreciation will have its duration largely determined by whether President Trump is correct in saying that the war will be over as Iran is bombed into oblivion over the next two to three weeks. We will likely never know whether Iran’s nuclear capability is completely obliterated or not. However, strange as it may seem, the writer is of the view that the war will be declared at an end by Trump in two to three weeks’ time, as he cannot afford to have his political popularity back at home plummeting for much longer. For this reason alone, the spike below 0.5700 in the Kiwi dollar will be as short-lived as the previous occasions.
Kiwi dollar plunge number five in the chart below is certainly taking a lot longer to rebound than we originally anticipated last year. The continuing negative interest rate differential to the USD has held the NZ dollar back from making any rapid rebound. The USD appreciation since the war started on 28 February from 97.00 to 100.00 on the Dixy Index has added another reason for the delay in the rebound. However, if “The Donald” is correct in his latest timeline that the war will be over in two or three weeks’ time, the unwinding of long-USD speculative positions in the currency markets entered since the war started, will provide the opportunity for the Kiwi dollar to return to above 0.6000 again.
Are the latest US jobs numbers as untrustworthy as the previous data?
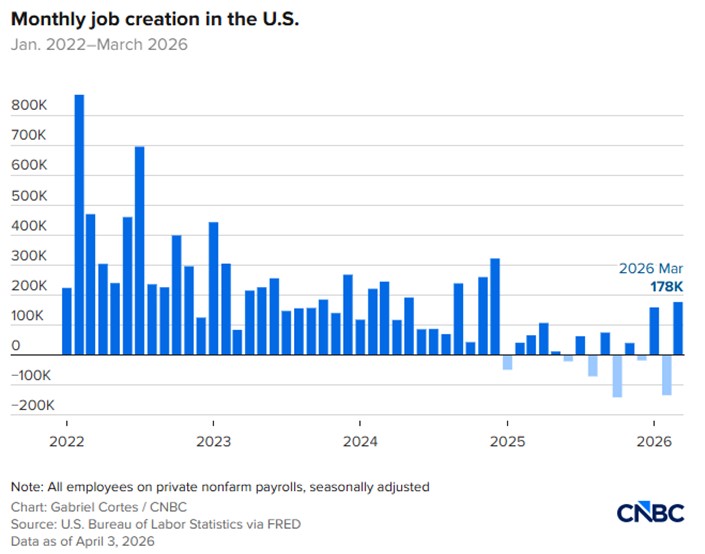
The volatility from month to month in US Non-Farm Payrolls jobs data is becoming something of a standing joke. In March, according to the data, 178,000 new jobs were added in the economy after a 133,000 loss of jobs in the month before in February (refer to the bar chart below). Neither statistic looks to be an accurate measure of what is really going on in the labour market. Over the last 12 months, the monthly job gains have roughly equated to the job losses, as the labour market contracts in both supply and demand. The immigration policies of the Trump regime are partially causing the wild swings, however there is no question of a reduced supply of labour. The unemployment rate, which is calculated from the separate survey of households, reduced from 4.40% to 4.26%, not due to more folk being employment, but from a reduced number of people looking for a job. The participation rate in the labour market reduced to 61.90%, the lowest levels since 2021. If demand was exceeding supply in US employment, wages would be pushed higher. However, that is not the case, with average hourly earnings increasing by 0.20% in March, less than prior consensus forecasts.
Most of the recent volatility in the jobs data is caused by the healthcare sector, a strike in February and return to work in March causing the dramatic changes. The pattern continues of healthcare industry workers contributing the majority of monthly gains in new jobs.
On top of the Iranian war causing gasoline price increases and therefore higher short-term inflation, the Federal Reserve voting members have a difficult job deciphering what the true situation is with employment in the US economy. Should the Iranian war end within weeks, the Fed will be “looking through” the short-term inflation increase and then working out whether the labour market needs monetary policy support with lower interest rates. The Senate Banking Committee hearing is set for mid-April to nominate Kevin Warsh as the next Fed Chair, replacing Jerome Powell. The market expectation is that Mr Warsh will have his riding instructions from the President to cut interest rates on the employment side of the mandate. The irony of that situation is that it is an admission that the US economy is not doing that well and needs help to create more jobs.
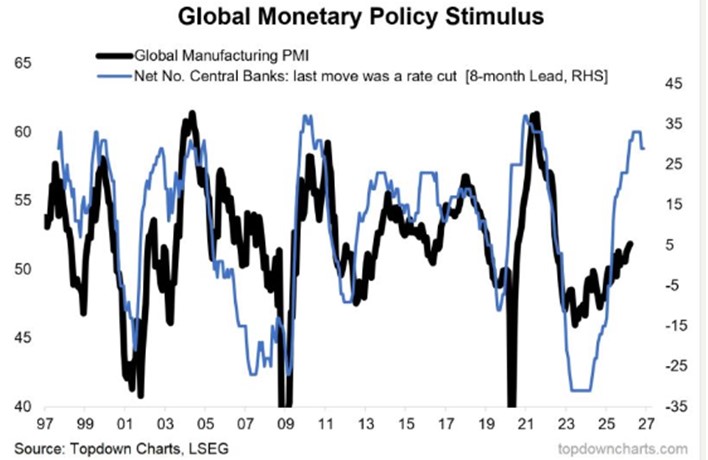
The second chart below (from Topdown charts) is more encouraging for the global economy (post war). Monetary stimulus through interest rate cuts is positive for manufacturing, with further strong gains likely over the coming period – always good news for the NZ economy.
Are the Japanese preparing for Yen currency intervention again?
The Japanese Finance Minister, Satsuki Katayama put currency traders on notice last Friday that the Japanese Government stands ready to act against speculative moves in FX markets. The “jawboning” warnings comes as the USD/JPY exchange rate nears 160.00, a line in the sand where the authorities have repeatedly stoked concerns that they will intervene directly in the currency markets to stop the Yen depreciating further. A weaker Yen increases inflation in Japan as imported oil prices soar. The next meeting of the Bank of Japan on interest rate settings is April 28th, so if they are serious about defending the Yen value, they would lift interest rates again. The argument against interest rate increases, is that all central banks are sitting pat right now until they see how long the Middle East conflict keeps oil prices elevated.
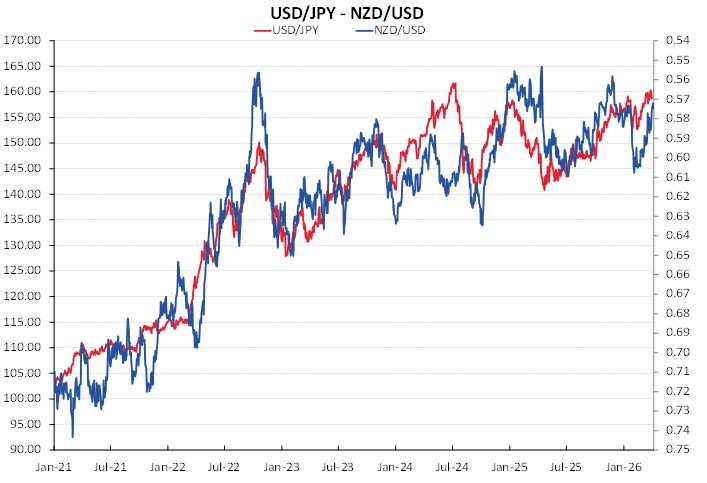
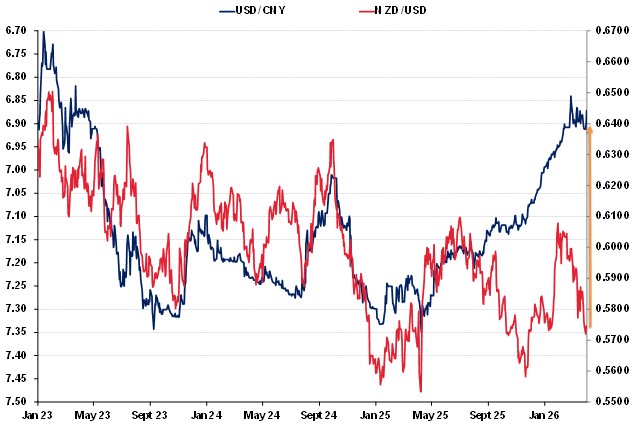
The chart below informs us that the NZD/USD exchange rate is closely correlated to USD/JPY movements. It also tells us that the Yen (red line) has weakened to the 160 level several times before over the last two years and failed to depreciate further. Another turnaround in the Yen back towards 150.00 would allow the NZD/USD exchange rate to return to 0.6000.
Why has the Chinese Yuan defied the odds against the stronger USD?
The Chinese Yuan exchange rate against the US dollar has hardly budged away from 6.9000 since the Iranian war started over a month ago. The Yuan has not depreciated against the USD as other currencies have done so. There are several reasons for the Yuan’s resilience: -
- The PBOC have maintained a stable daily fixing of the Yuan to prevent speculation against the currency that would increase inflation through higher oil import costs.
- China is 80% self-sufficient in energy; therefore, their economy is not a vulnerable as other Asian economies to oil price shocks.
- China’s capital and trade flows have remained stable. Their exports are strong with exporters selling USD proceeds to buy Yuan.
- The Iranian war has boosted the use of the Yuan for trading oil and fees for ships moving through the Strait of Hormuz are priced in Yuan, increasing demand for the currency.
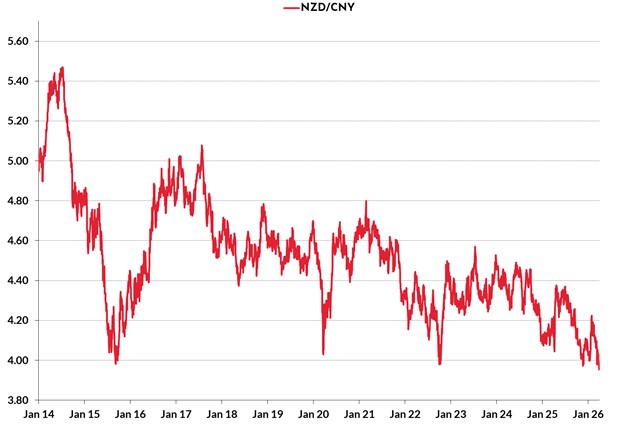
The three cent pull back in the Kiwi dollar from 0.6000 to 0.5700 since the war started, contrasts against the stability of the Yuan (first chart below). The NZD/USD exchange rate has disconnected from the previous close correlation to the USD/CNY rate. As a result of the divergence, the NZD/CNY cross-rate (second chart below) has plunged to previous lows below 4.0000 at 3.9200. The Kiwi dollar has recovered against the Yuan from such lows on previous occasions. It will require independent NZ dollar appreciation based on NZ interest rates rising above those of the US to turn around the NZ dollar’s fortunes and cause a recovery of the NZD/CNY cross-rate.
Daily exchange rates
Select chart tabs
*Roger J Kerr is Executive Chairman of Barrington Treasury Services NZ Limited. He has written commentaries on the NZ dollar since 1981.
We welcome your comments below. If you are not already registered, please register to comment
Remember we welcome robust, respectful and insightful debate. We don't welcome abusive or defamatory comments and will de-register those repeatedly making such comments. Our current comment policy is here.