

Summary of key points: -
- The US dollar still appears vulnerable to weaker US economic data
- NZD/AUD cross-rate prime for a recovery?
The US dollar still appears vulnerable to weaker US economic data
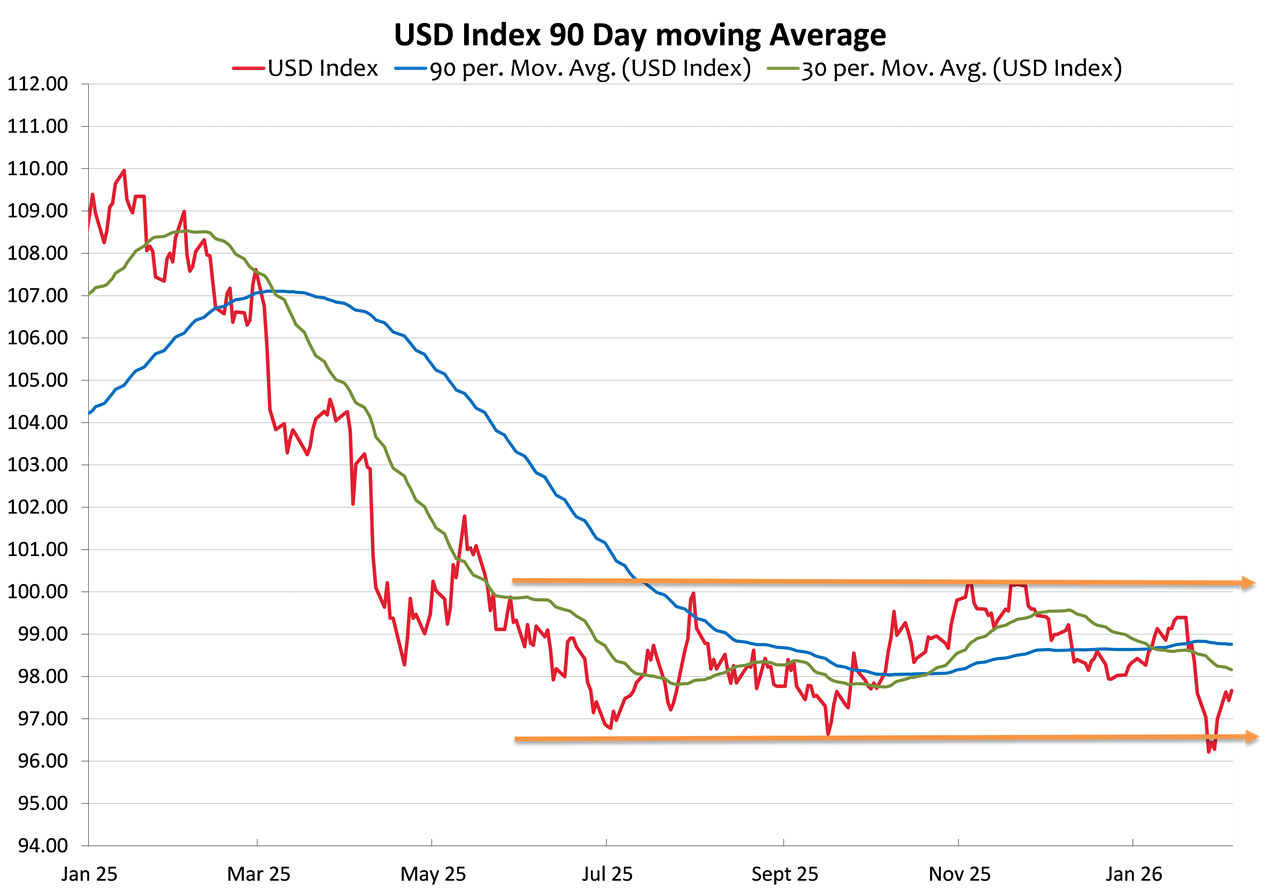
For the last 10 months, since Trump’s trade tariffs “Liberation Day’ in April 2025, the value of the US dollar has oscillated between 96.00 and 100.00 on the USD Dix Currency Index. The constant ups and downs driven by wavering convictions about the US economy, US interest rates and geopolitical risk events.
The 2026 year started with another loss of confidence in the US dollar as global investors returned to the “Sell America” trade that depreciated the currency early last year. Over recent months it has been escalating geopolitical tensions in Iran, Venezuela and Trump’s Greenland fiasco that have delivered the bouts of US dollar appreciation as investor safe haven flows into the USD are still triggered in times of international uncertainty. On the other hand, as those geopolitical risks/tensions subside away, the US dollar is rapidly sold back down by the markets. The latest bounce back up in the US dollar from 96.00 on the Dixy Index to the current 97.50 being associated with rising geopolitical risks with Iran and some better-than-expected US economic data.
The sell off in the US dollar in January from 99.00 to 96.00 allowed the NZD/USD exchange rate to finally recover from trading below 0.6000 for many months. The Kiwi dollar gains were aided by a resurging Australian dollar value as the markets and the Reserve Bank of Australian pivoted from interest rate cuts to interest rate hikes.
The sideways pattern of the US dollar direction since the falls in early 2025 is largely attributable to two forces in the global FX markets: -
- Disagreement and uncertainty as to the speed and extent of US interest rate cuts by the Federal Reserve in 2026. The Fed themselves are hopelessly divided on the whether US inflation and employment is moving higher or lower. Interest rate differentials are a massive determinant of currency values and direction. Weaker employment and inflation numbers in the US economy would certainly point to earlier Fed interest rate cuts and a lower US dollar.
- Capital inflows into US markets matching outflows. Foreign investment fund managers certainly exited the US last year and in January this year as they lost confidence in the Trump regime’s whacky and unpredictable economic policies. The global funds also sold the USD as they increased hedge percentages on their USD asset exposures. However, matching those outflows was money coming into the US markets from equity investors chasing the AI revolution and the listed stocks in the US at the forefront of that revolution.
The question for currency risk managers at this time is whether the US equity markets will continue to price the AI stocks ever higher, or is a reality check coming that will slow and end the foreign inflows into the US AI stocks? We suspect the latter is the more likely outcome this year. In respect to the divided Fed and interest rate decisions, the various measures of the US economy will determine whether the USD Dixy Index holds within its current trading range, or it breaks below the 96.00 bottom barrier.
The markets are struggling to draw clearcut conclusions on whether US inflation and employment is going higher or lower. Economic measures such as GDP growth and retail sales have generally come out stronger than forecast, providing hope for some pundits that US “economic exceptionalism” is alive and well in 2026. Our view is that the Fed will be forced to return to interest rate cuts earlier and more aggressively over coming months, as the inflation and employment data being released will not allow them to make any other decision. On the inflation front, continuing deflation in the housing and services sector is more than outweighing any goods inflation from tariffs. Looking back over the last 12 months, the impact on US inflation from Trump’s tariffs has been much less than anyone expected. Weaker consumer demand is not allowing retailers/distributors to pass on the full tariff cost on imported goods. There has to be more confidence from more Fed board members that US inflation is heading back to 2.00% and is not staying at 3.00%.
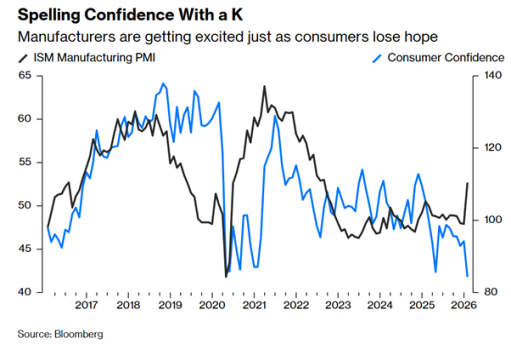
In respect to US employment trends, the Federal Government shutdowns have disrupted the timing and accuracy of the monthly Non-Farm Payrolls jobs data, making it difficult for the markets to obtain a clear picture of the employment landscape. Last week, the private sector ADP Employment Change figures for the month of January were particularly soft, just an increase of 22,000 jobs against prior forecasts of +48,000. The job vacancies (JOLTS) figures for December were also weak with job vacancies dropping to 6.54 million compared to prior forecasts of 7.00 million. Earlier last week, the USD dollar posted gains when the ISM Manufacturing PMI survey for January jumped higher to 52.6 from 48.2 in December (refer to the chart below). However later in the week the associated ISM Services PMI data was flat on the previous month. The unexpected increase in the manufacturing PMI numbers in January appear to us to be a rogue number, as nothing else points to a massive increase in confidence in the middle of US winter snowstorms and disrupted travel.
The January Non-Farm Payrolls jobs data release has been delayed until this Wednesday (Thursday morning NZT). Consensus forecasts are for an increase between 40,000 and 70,000 jobs, however a much weaker outcome would not surprise. US CPI inflation data for January is released on Friday 13th February (Saturday morning NZT), again a monthly increase at the lower end of the +0.10% to +0.30% forecast range would seem more likely. A +0.10% increase in inflation for the month would reduce the annual rate of inflation from 2.70% to 2.40% and provide much more comfort to the inflation doubters at the Fed.
The likely FX market response of US jobs and inflation data this week will be to sell the USD lower as the data is printed on the weaker side. Further NZD and AUD gains above the key levels of 0.6000 and 0.7000 seem likely on the expected next bout of USD depreciation.
NZD/AUD cross-rate prime for a recovery?
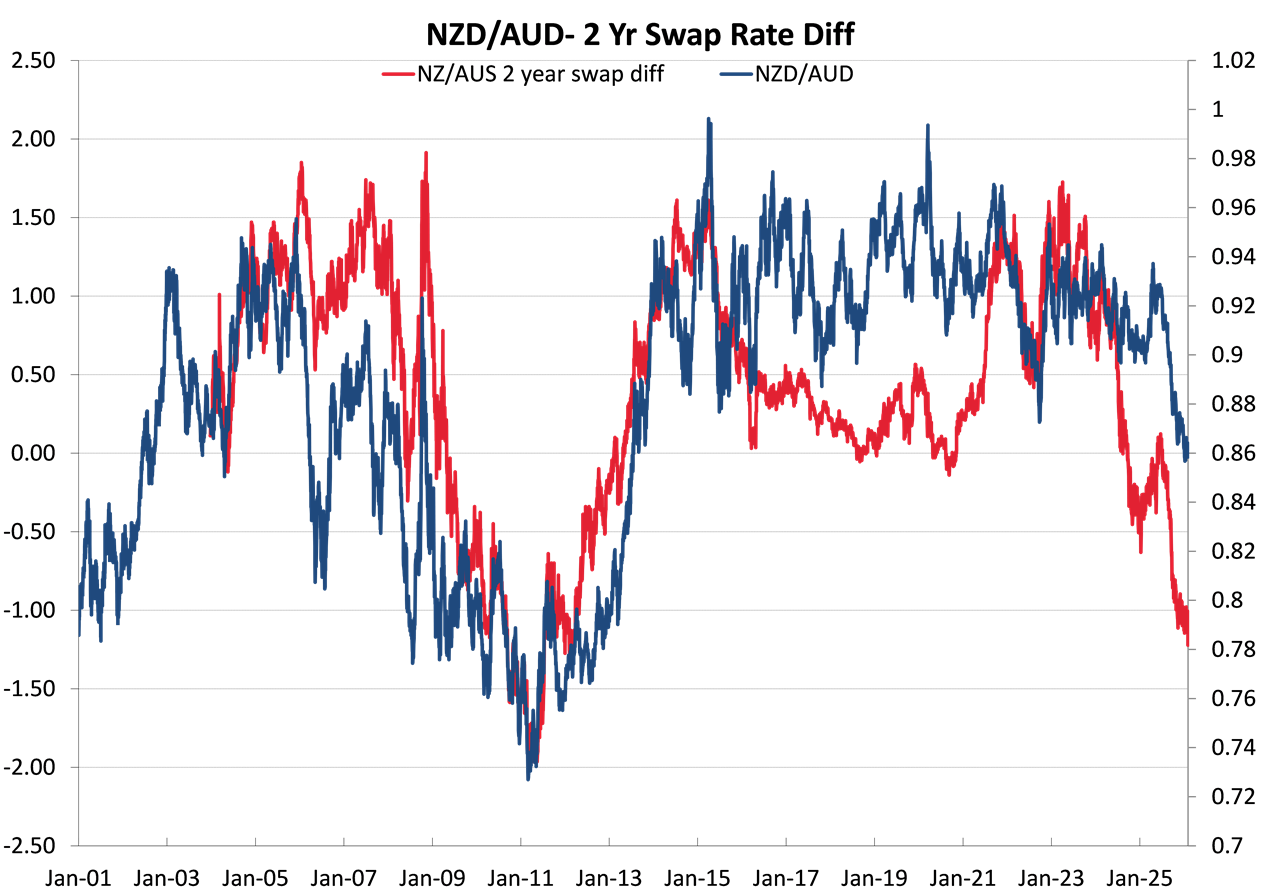
There is no questions that the dramatic shift in the interest rate differential between Australia and New Zealand over the last 12 months has driven the NZD/AUD cross-rate sharply lower from 0.9300 last July to 0.8600 today. The two-year swap interest rate differential jumped from a 0.00% gap in early 2025 to 1.00% today as the RBNZ cut interest rates far more aggressively to a 2.25% OCR, whereas the RBA stopped cutting at 3.60% and have recently increased to 3.85%. With NZ interest rates so much below those in Australia, why would any global currency investor prefer NZ over the higher yielding AUD. The plunge in the NZD/AUD cross-rate since July last year is a real boost for local exporters selling into Australia, however it does marginally increase domestic inflation as we import a bunch of food items from Australia.
The first chart below that plots the interest rate differential against the NZD/AUD cross-rate, and on the surface, it does suggest that the NZD/AUD has much further to fall to 0.8000. The NZD/AUD cross-rate has not been at 0.8000 since 2013 when Australia was benefiting from a mining boom and the AUD appreciated much more against the USD compared to the NZD/USD rate. Today, New Zealand’s commodity export prices and volumes are arguably doing a lot better than Australia’s. Both the RBA and RBNZ will be lifting interest rates this year as inflation in both countries remain sticky high above the target bands.
The drop in the NZD/AUD cross-rate was also due to speculators taking positions that the RBNZ would be easing monetary policy far more than the RBA. That strategy to sell the NZD against the AUD has proven to be correct and the speculators are sitting on large/unrealised FX profits on their positioning. Going forward, it appears to us that there is a far greater probability that the punters holding short-sold NZD positions against the AUD are more likely to take their profits (buying the NZD is doing so) than to add to their positions. There is a good argument that the NZD/AUD rate has found its bottom at 0.8600 and will not depreciate any further. What the speculators do next will be important for the future direction of the NZD/AUD cross-rate.
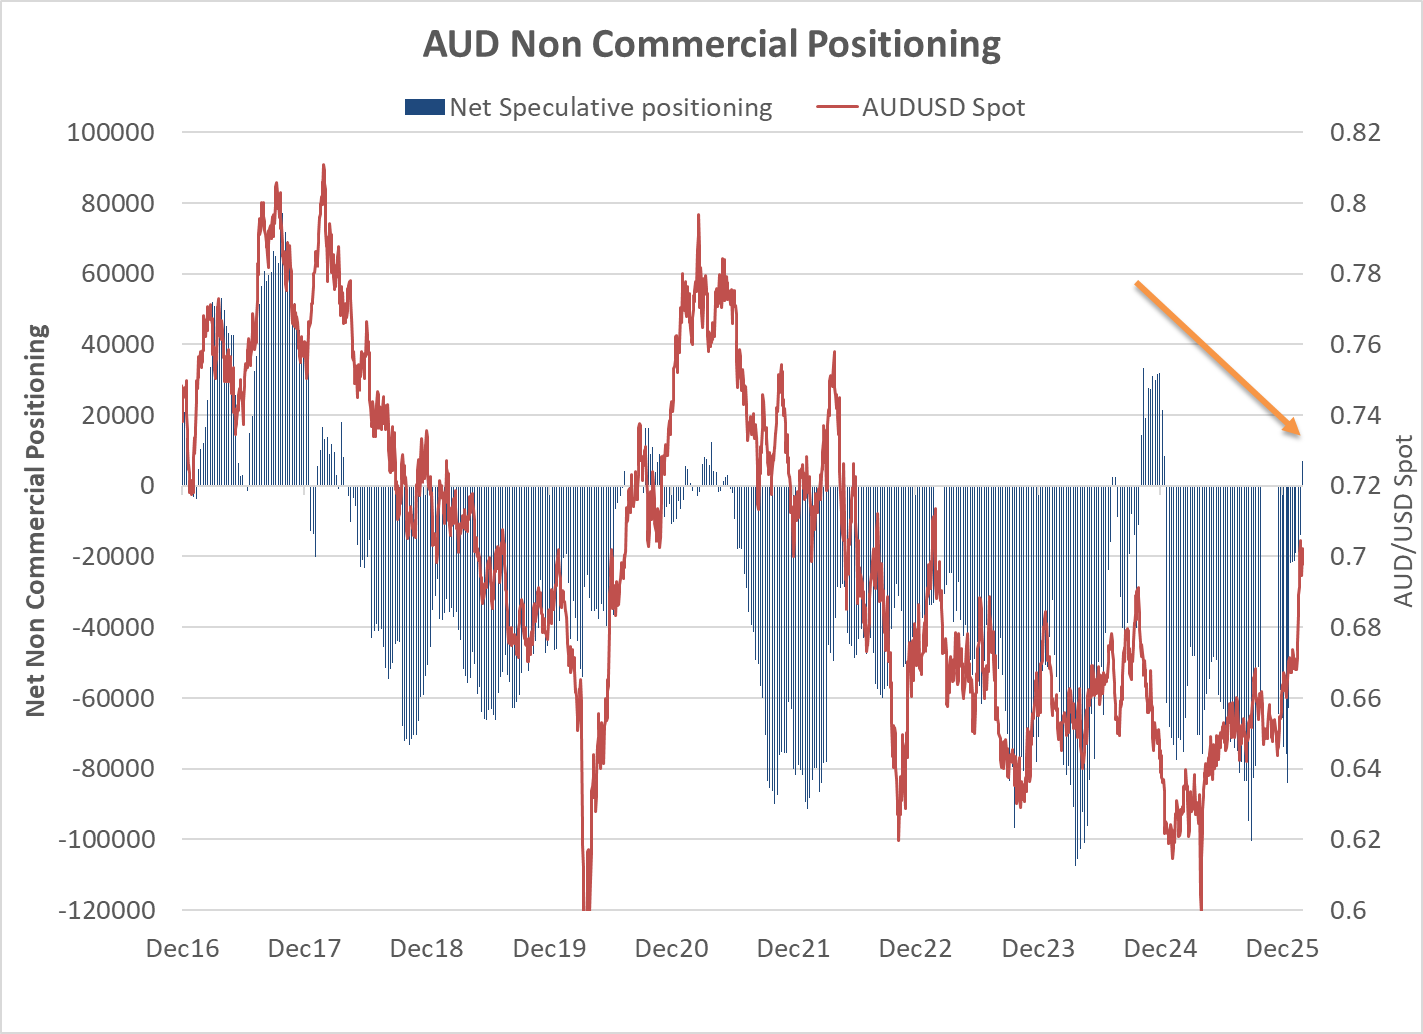
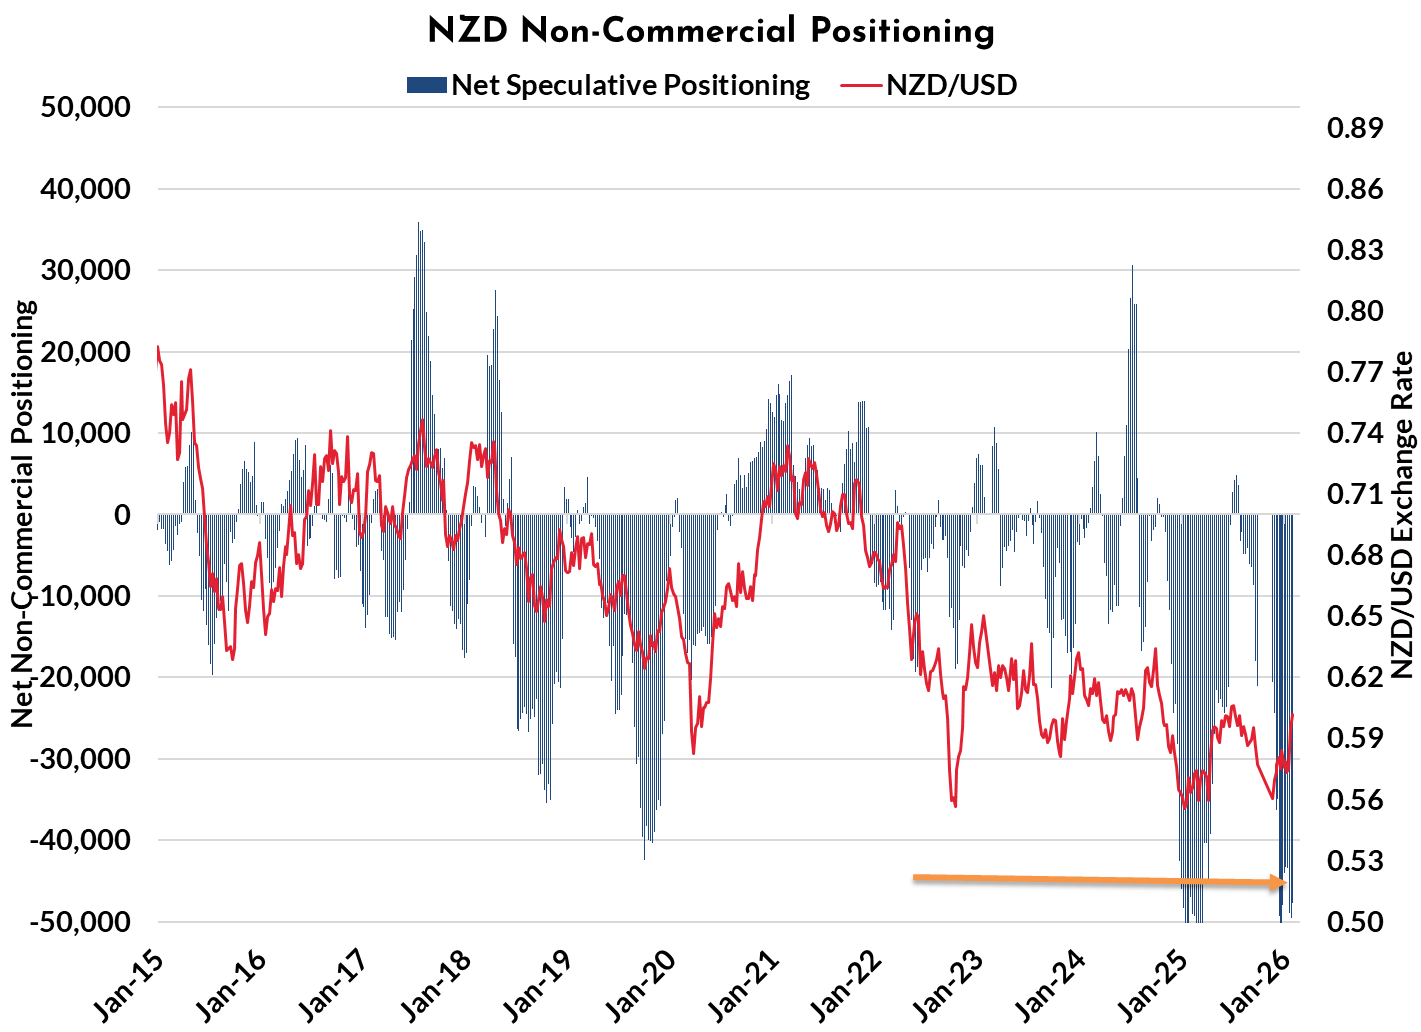
The following two charts plot the AUD/USD and NZD/USD exchange rate movement against the open “non-commercial” currency futures contracts in the US (blue bars on the charts). Whilst the futures contracts are only a small part of the total FX markets, they are a representative sample of the overall sentiment and speculative positioning. Over recent weeks the currency punters have rapidly shifted their positioning from being short-sold the AUD (anticipating a weaker AUD) to now being net long the AUD (orange arrow on the first chart). The resultant AUD buying has been a contributing factor to the AUD/USD exchange rate lifting dramatically from 0.6500 to 0.7000 over recent weeks.
The current speculative positioning in the NZD/USD exchange rate is markedly different to the Australian dollar positioning. The currency punters remain short-sold the Kiwi dollar (orange arrow on the second chart). The recent appreciation of the NZD to above 0.6000 against the USD has these currency speculators “out-of-the-money” on their bets, so they are now more likely to buy the NZD to close down their positions.
The three-cent appreciation of the NZ dollar from 0.5700 to above 0.6000 may only be the start of the gains, judging by the anticipated closing down of short-sold NZD positions. Should the NZD buying from the changing speculative positioning turn out to be greater than AUD buying from here, the NZD/AUD cross-rate is more likely to heading higher than lower.
Daily exchange rates
Select chart tabs
*Roger J Kerr is Executive Chairman of Barrington Treasury Services NZ Limited. He has written commentaries on the NZ dollar since 1981.
We welcome your comments below. If you are not already registered, please register to comment
Remember we welcome robust, respectful and insightful debate. We don't welcome abusive or defamatory comments and will de-register those repeatedly making such comments. Our current comment policy is here.